Choice Central Avenue Retail Opportunity > Galleria at Grand Central
here is a rare opportunity to put your Business or Career on Central Avenue.
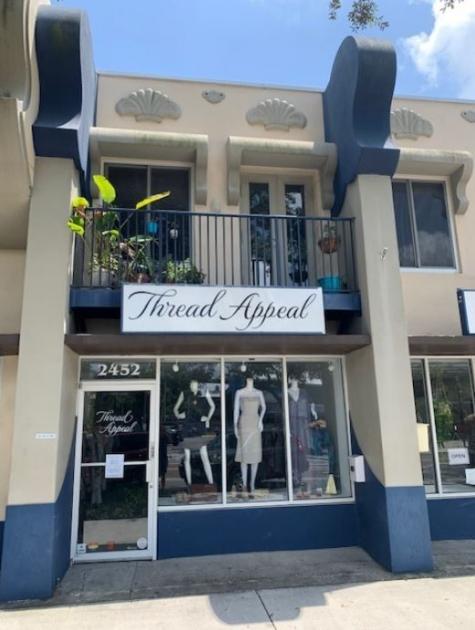
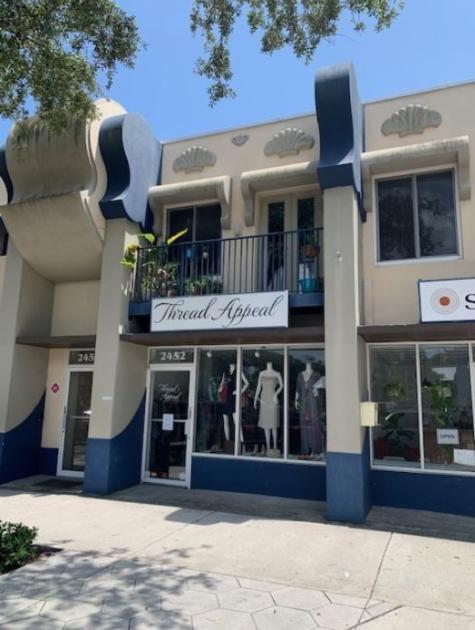
Our Offering is for 1,291 sf of newer second-generation retail space with large storefront windows, superb exposure, and excellent signage. The Site is in the Grand Central Dining and Shopping District.
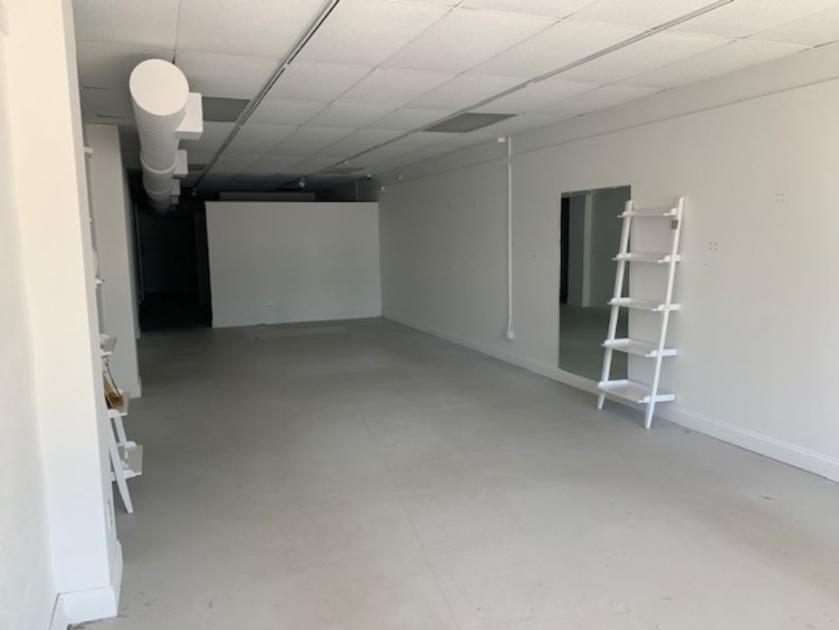
The Site consists of a large front open retail area with nice ceiling heights and grand beams of natural light. Four dressing rooms abut the retail section, then a lounge area, followed by a restroom and a very large back storage and staging room.
The Zoning is excellent allowing for numerous retail uses such boutiques, gift shops, cafe, salon, spa, gallery, and more. The Space is also appropriate for office uses, such as law, accounting, financial, medical, brokers, services, and general office.
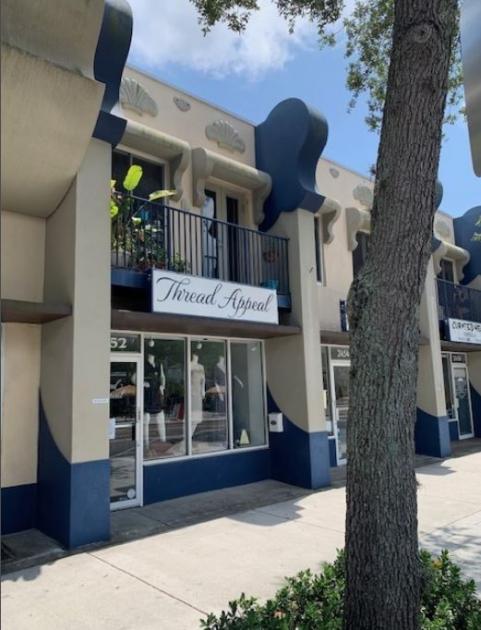
Location Description: The Address is the 2400 Block of Central Avenue on the southside of the Avenue between 24th Street and 25h Street. The Site is located on one of the best blocks of the Shopping & Dining District known as Grand Central.
The address is surrounded by popular and excellent co-tenants, such as Key West Grill, The Escape Room, The Queens Head, Dog Bar, Casita Taqueria, Trophy Fish, Urban Brew & BBQ, Art Pool, School of Rock, Numex, Bandit Coffee, Blue Cottage, The Bikery, Three Daughters, Cage Brewery, Pinellas Ale Works, and approximately 70 more not listed.
The Site is also abutting the well known historic Kenwood Neighborhood, the Arts Warehouse District, and The Edge Shopping & Dining District.
The Site is only minutes from the Interstate, US HWY 19 North, Three Major Hospitals, Two Universities, Beach Drive, and the Downtown Core.