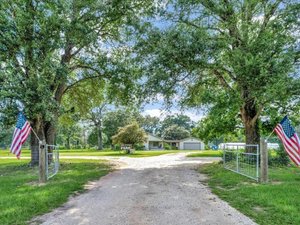
1-Mile | 3-Miles | 5-Miles | ||
---|---|---|---|---|
Total Population | 1,464 | 20,768 | 69,695 | |
Population Median Age | 40 | 38 | 38 | |
Population by Age | 0-9 Yrs | 137 (9%) | 2665 (12%) | 10033 (14%) |
10-19 Yrs | 128 (8%) | 2826 (13%) | 9219 (13%) | |
20-29 Yrs | 193 (13%) | 2820 (13%) | 8836 (12%) | |
30-39 Yrs | 280 (19%) | 2965 (14%) | 9552 (13%) | |
40-49 Yrs | 197 (13%) | 2519 (12%) | 8478 (12%) | |
50-59 Yrs | 220 (15%) | 2580 (12%) | 9022 (12%) | |
60-69 Yrs | 210 (14%) | 2271 (10%) | 7854 (11%) | |
70+ Yrs | 100 (6%) | 2122 (10%) | 6700 (9%) | |
Median HH Income | $46,169 | $59,139 | $56,018 | |
Total Household Income | < 24K | 117 (18%) | 1365 (18%) | 5683 (22%) |
25-49K | 246 (39%) | 1807 (24%) | 5784 (23%) | |
50-74K | 88 (14%) | 1165 (15%) | 3958 (15%) | |
75-99K | 63 (10%) | 1079 (14%) | 3476 (13%) | |
100-199K | 77 (12%) | 1485 (20%) | 4897 (19%) | |
200K+ | 37 (5%) | 440 (5%) | 1236 (4%) | |
Highest Education Level | No Diploma | 150 | 1696 | 7062 |
Diploma or GED | 387 | 4597 | 14505 | |
Some College | 286 | 3915 | 12998 | |
Assoc. Degree | 86 | 1235 | 3941 | |
Bachelors Degree | 137 | 1940 | 5774 | |
Higher Degree | 66 | 737 | 2186 | |
Total Housing Units | 746 | 8,313 | 28,903 | |
--Owner-Occupied | 210 | 4,466 | 16,151 | |
--Renter-Occupied | 418 | 2,875 | 8,883 | |
Owner-Occupied Values | < 100K | 21 | 1232 | 5338 |
100-199K | 113 | 2214 | 7025 | |
200-299K | 32 | 685 | 2451 | |
300-399K | 27 | 176 | 622 | |
400-499K | 15 | 113 | 388 | |
500K+ | 2 | 46 | 326 | |
Total Working Age Population | 1,247 | 16,381 | 53,779 | |
In Work Force | 790 | 10,100 | 33,457 | |
Not In Work Force | 458 | 6,281 | 20,322 | |
Workforce Employed | 772 | 9,305 | 30,762 | |
Workforce Unemployed | 18 | 784 | 2,627 | |
Civlian Workforce | 790 | 10,089 | 33,389 | |
Military Workforce | 0 | 11 | 68 | |
Total Households | 627 | 7,341 | 25,033 | |
Family Households | 317 | 5,039 | 17,379 | |
Non-Family Households | 311 | 2,302 | 7,654 | |
Married Couple | 226 | 3,455 | 11,735 | |
Other Family | 90 | 1,584 | 5,644 | |
Married w/Child | 59 | 1,230 | 4,486 | |
Single Male w/Child | 8 | 130 | 580 | |
Single Female w/Child | 41 | 728 | 2,518 |
Population Change Last Two Decades - Plus Projection
2000 | % | 2010 | % | 2020 | % | 2030 | |
---|---|---|---|---|---|---|---|
Texas | 20,851,820 | +21 | 25,145,561 | +18 | 29,677,668 | +18 | 34,894,452 |
Brazoria County | 241,767 | +30 | 313,166 | +20 | 375,869 | +20 | 452,517 |
Galveston County | 250,158 | +16 | 291,309 | +22 | 355,196 | +20 | 427,028 |
Total Working Age Population:
Total Households:
Total Working Age Population:
Total Households:
Total Working Age Population:
Total Households: