Commercial Land
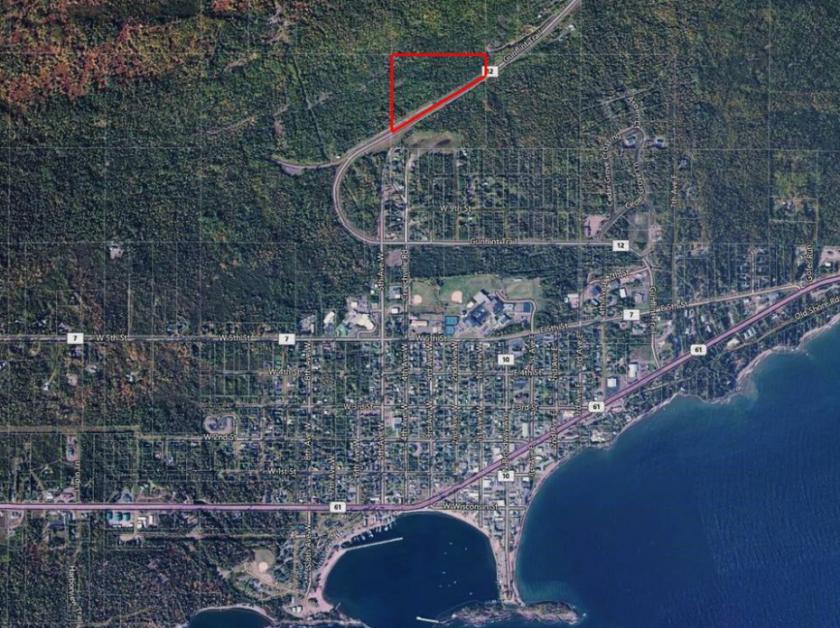
Land For Sale - XXX Gunflint Trail Grand Marais, MN 55604
Land For Sale - XXX Gunflint Trail Grand Marais, MN 55604
Details & Description
Property Highlights
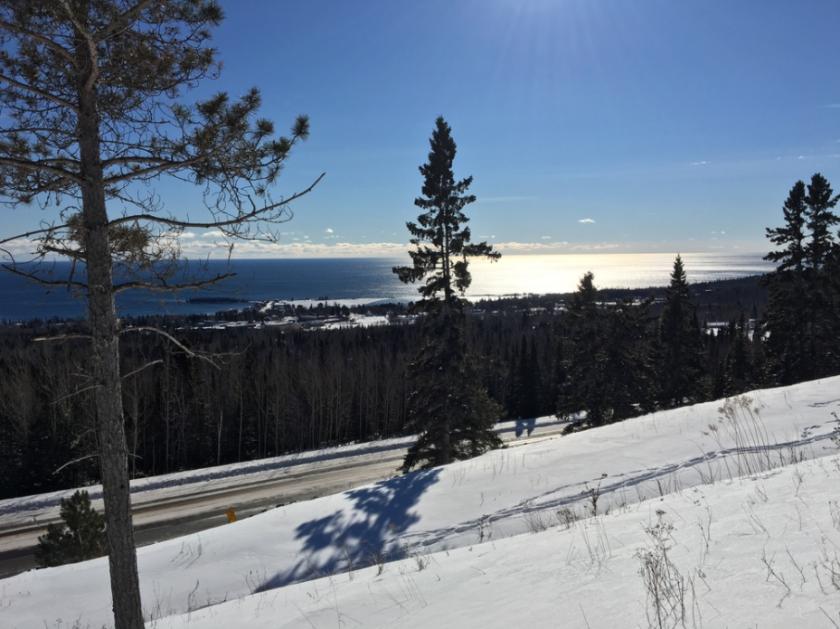
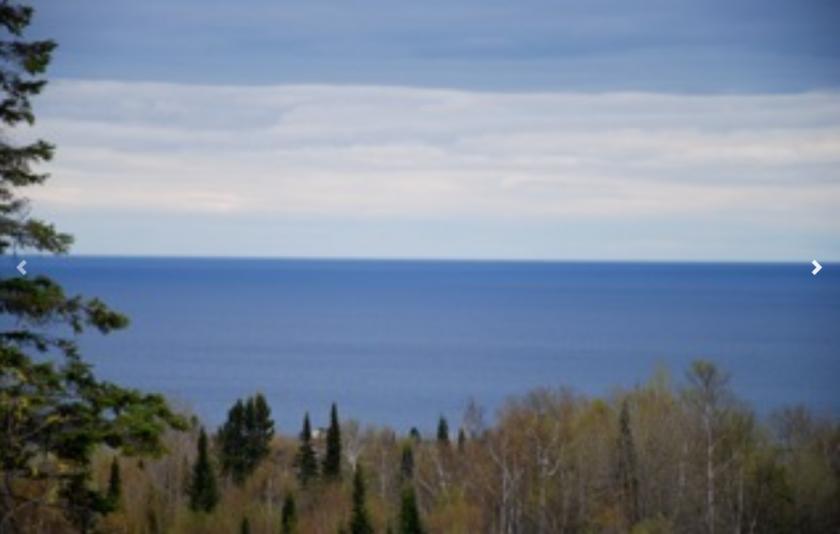
• Potential uses for this site include recreation, resort, lodging, restaurant, planned unit development
• Zoning RecreationCommercial
Listing Agents

Jeffrey Meehan
KW Commercial
O: 612-991-6360
jeff.meehan@kwcommercial.com
KW Commercial
O: 612-991-6360
jeff.meehan@kwcommercial.com
While we strive to provide the most accurate information, all listing information, and demographic data, is provided by third-parties. As such, MyEListing will not be responsible for the accuracy of the information. It is strongly recommended that you verify all information with the listing agent, and any relevant agencies, prior to making any decisions.