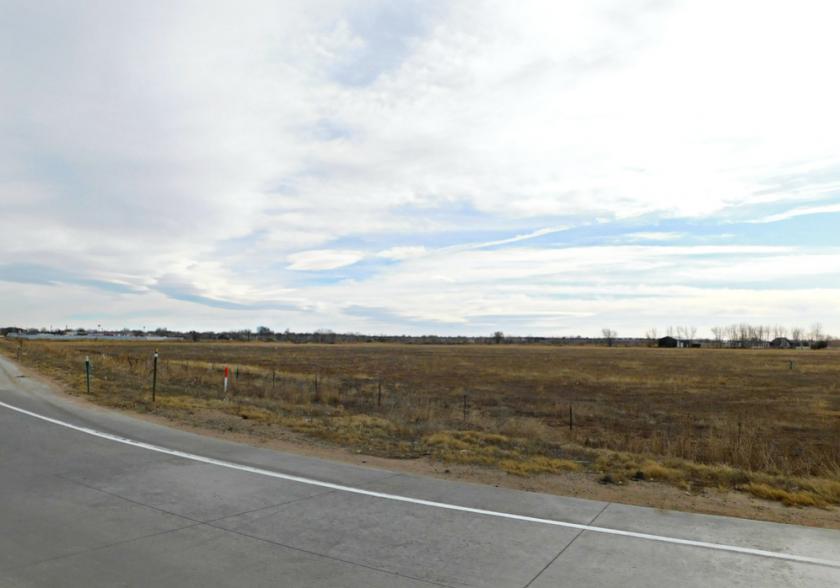
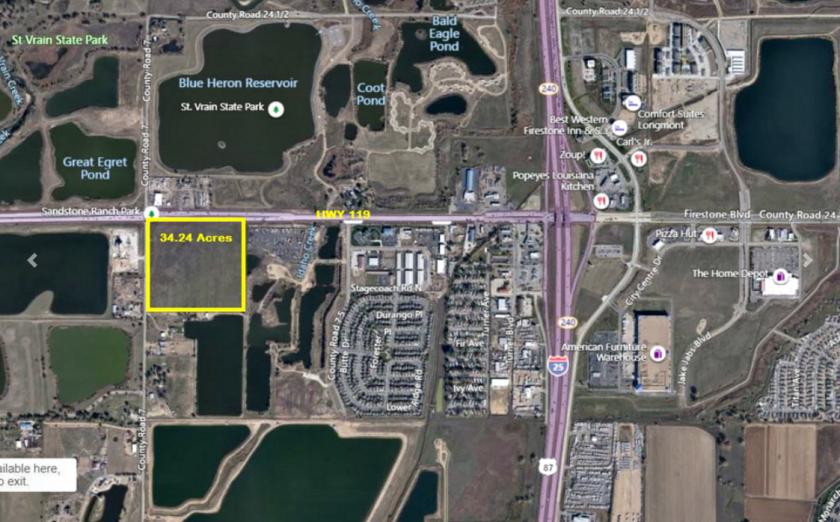
Incredible Development Opportunity Right on Hwy 119 and CR 7. Only 1 mile West from Interstate I-25.
Two 18 inch water lines to tap in.
C-C Commercial District, Community. Intent: This is a commercial district intended to provide for the location of auto-oriented and auto-dependent uses and/or uses which provide a wide range of general retail goods and services for residents of the entire community, as well as businesses and highway users, primarily inside of enclosed structures.
Permitted Uses per Town of Frederick:
Mixed use dwelling units. Community facilities, park and open space. Public Schools. Public facilities. Special Schools. Transit facilities. Accessory Buildings. Photography studios and galleries. Minor auto repair. Bed and Breakfast. Car wash. Child Care center. Bars and Taverns. Food catering. Small food production. Health and membership clubs. Gas station. Small grocery store. Hotel, motel or lodging establishments. Kennels. Long term care facilities. Medical and dental offices and clinics. Restaurants. Retail/Commercial Establishments. Tourist facilities. And others.
No part of this information may be copied, reproduced, repurposed, or screen-captured for any commercial purpose without prior written authorization from MyEListing.
While we strive to provide the most accurate information, all listing information, and demographic data, is provided by third-parties. As such, MyEListing will not be responsible for the accuracy of the information. It is strongly recommended that you verify all information with the listing agent, and any relevant agencies, prior to making any decisions.
What is the asking price for 34.24 Acres on HWY 119 and CR7 in Longmont?
The asking price for 34.24 Acres on HWY 119 and CR7 is $3,500,000
How much land does the Longmont, CO property at 34.24 Acres on HWY 119 and CR7 include?
34.24 Acres on HWY 119 and CR7 in Longmont includes 34.240 acres of land
What kind of Land is the propery at 34.24 Acres on HWY 119 and CR7?
The property at 34.24 Acres on HWY 119 and CR7 Longmont, CO 80504 is listed as a Retail Land Land property
What is the population within 1 mile of 34.24 Acres on HWY 119 and CR7 in Longmont?
The population within 1 mile of 34.24 Acres on HWY 119 and CR7 Longmont, CO 80504 is 599 people.
Who do I contact for questions about 34.24 Acres on HWY 119 and CR7?
You should contact the listing agent,
Edite Lawrence, for any details regarding this commercial listing.