Multifamily Housing
West Seventh St. Paul 16 Unit Apartment Building - Add Saint Paul, MN 55101
West Seventh St. Paul 16 Unit Apartment Building - Add Saint Paul, MN 55101

Details & Description
Property Highlights
• Please reach out to Amber Lange for financials, additional information, and access.
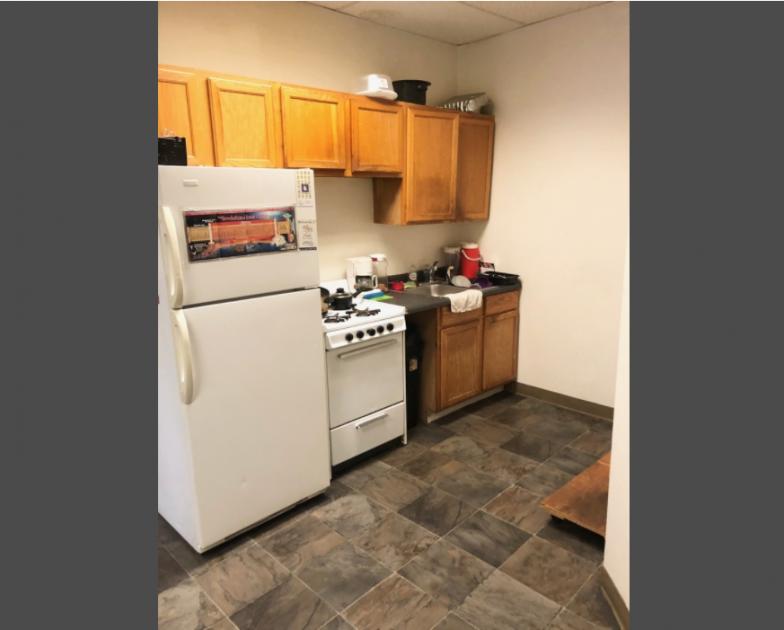
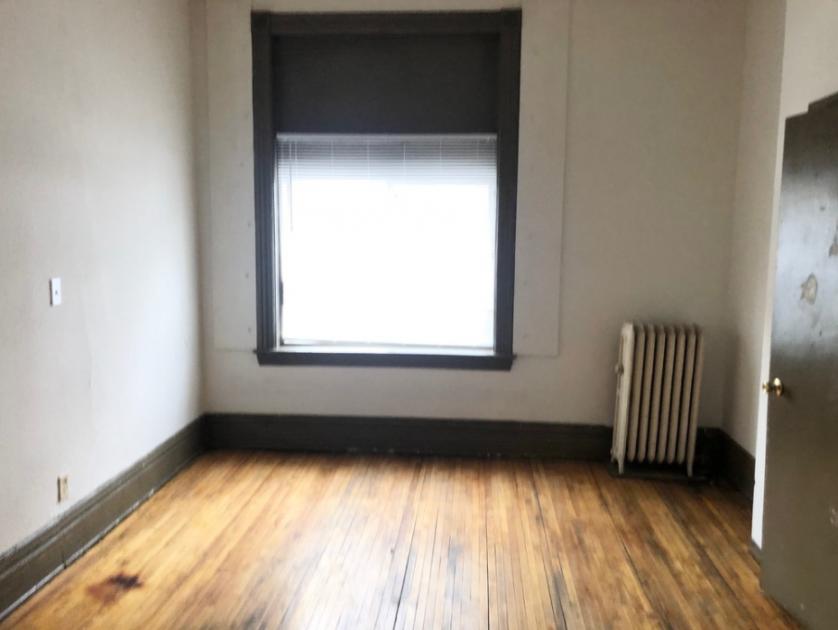
• 16 unit apartment building for sale in the West Seventh Neighborhood of St. Paul
Listing Agents

Amber Lange
KW Commercial
O: 763-226-7911
M: 763-226-7911
alange@kwcommercial.com
KW Commercial
O: 763-226-7911
M: 763-226-7911
alange@kwcommercial.com
While we strive to provide the most accurate information, all listing information, and demographic data, is provided by third-parties. As such, MyEListing will not be responsible for the accuracy of the information. It is strongly recommended that you verify all information with the listing agent, and any relevant agencies, prior to making any decisions.