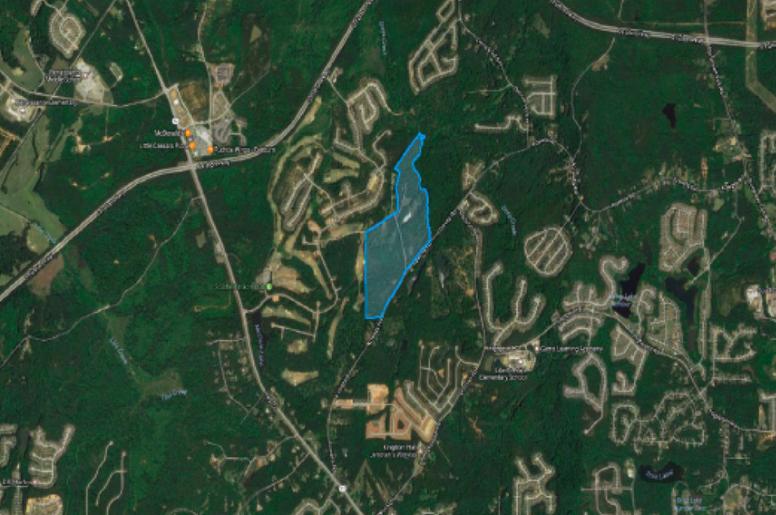
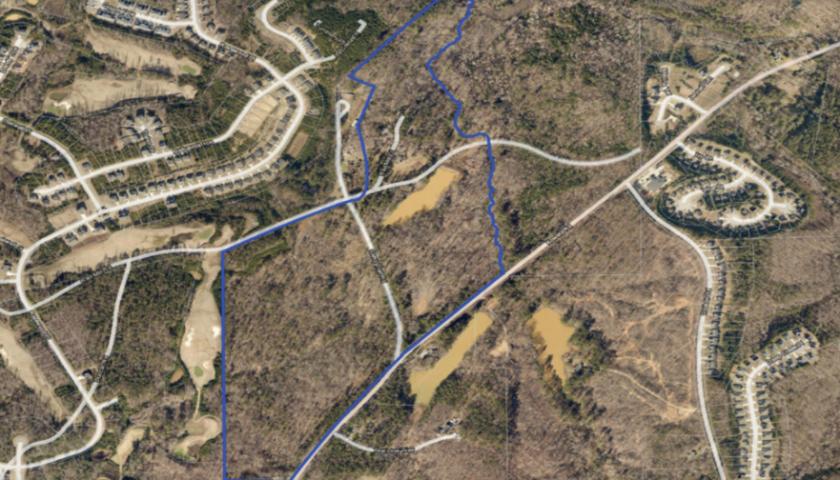
1-Mile | 3-Miles | 5-Miles | ||
---|---|---|---|---|
Total Population | 2,652 | 27,950 | 73,902 | |
Population Median Age | 34 | 35 | 34 | |
Population by Age | 0-9 Yrs | 404 (15%) | 4208 (15%) | 11873 (16%) |
10-19 Yrs | 401 (15%) | 4658 (16%) | 11123 (15%) | |
20-29 Yrs | 349 (13%) | 2995 (10%) | 9342 (12%) | |
30-39 Yrs | 495 (18%) | 4355 (15%) | 11005 (14%) | |
40-49 Yrs | 334 (12%) | 4554 (16%) | 11762 (15%) | |
50-59 Yrs | 279 (10%) | 3086 (11%) | 8259 (11%) | |
60-69 Yrs | 251 (9%) | 2663 (9%) | 6733 (9%) | |
70+ Yrs | 139 (5%) | 1432 (5%) | 3804 (5%) | |
Median HH Income | $66,693 | $64,266 | $60,474 | |
Total Household Income | < 24K | 115 (12%) | 1514 (16%) | 4280 (17%) |
25-49K | 224 (23%) | 2080 (22%) | 5817 (23%) | |
50-74K | 200 (21%) | 1788 (19%) | 5183 (20%) | |
75-99K | 233 (24%) | 1769 (19%) | 4160 (16%) | |
100-199K | 163 (17%) | 1926 (20%) | 4870 (19%) | |
200K+ | 8 (0%) | 218 (2%) | 681 (2%) | |
Highest Education Level | No Diploma | 95 | 1164 | 2954 |
Diploma or GED | 361 | 4837 | 12665 | |
Some College | 625 | 4443 | 11103 | |
Assoc. Degree | 174 | 1733 | 4576 | |
Bachelors Degree | 255 | 3546 | 9686 | |
Higher Degree | 170 | 1967 | 5751 | |
Total Housing Units | 1,035 | 10,196 | 27,758 | |
--Owner-Occupied | 596 | 5,723 | 14,341 | |
--Renter-Occupied | 347 | 3,573 | 10,650 | |
Owner-Occupied Values | < 100K | 97 | 1199 | 2570 |
100-199K | 273 | 2506 | 6412 | |
200-299K | 195 | 1473 | 3721 | |
300-399K | 13 | 394 | 1256 | |
400-499K | 3 | 66 | 221 | |
500K+ | 15 | 85 | 161 | |
Total Working Age Population | 1,991 | 20,500 | 54,620 | |
In Work Force | 1,462 | 14,357 | 38,602 | |
Not In Work Force | 529 | 6,143 | 16,019 | |
Workforce Employed | 1,370 | 13,432 | 36,117 | |
Workforce Unemployed | 90 | 917 | 2,472 | |
Civlian Workforce | 1,460 | 14,348 | 38,589 | |
Military Workforce | 2 | 8 | 12 | |
Total Households | 943 | 9,296 | 24,991 | |
Family Households | 599 | 6,220 | 16,490 | |
Non-Family Households | 345 | 3,076 | 8,501 | |
Married Couple | 343 | 3,222 | 8,101 | |
Other Family | 255 | 2,998 | 8,389 | |
Married w/Child | 203 | 1,838 | 4,010 | |
Single Male w/Child | 11 | 293 | 958 | |
Single Female w/Child | 95 | 1,250 | 3,645 |
Population Change Last Two Decades - Plus Projection
2000 | % | 2010 | % | 2020 | % | 2030 | |
---|---|---|---|---|---|---|---|
Georgia | 8,186,453 | +18 | 9,687,653 | +12 | 10,833,472 | +13 | 12,292,423 |
Douglas County | 92,174 | +44 | 132,403 | +15 | 151,906 | +20 | 182,157 |
Fayette County | 91,263 | +17 | 106,567 | +10 | 117,544 | +17 | 137,595 |
Fulton County | 816,006 | +13 | 920,581 | +19 | 1,099,181 | +18 | 1,300,861 |
Total Working Age Population:
Total Households:
Total Working Age Population:
Total Households:
Total Working Age Population:
Total Households: