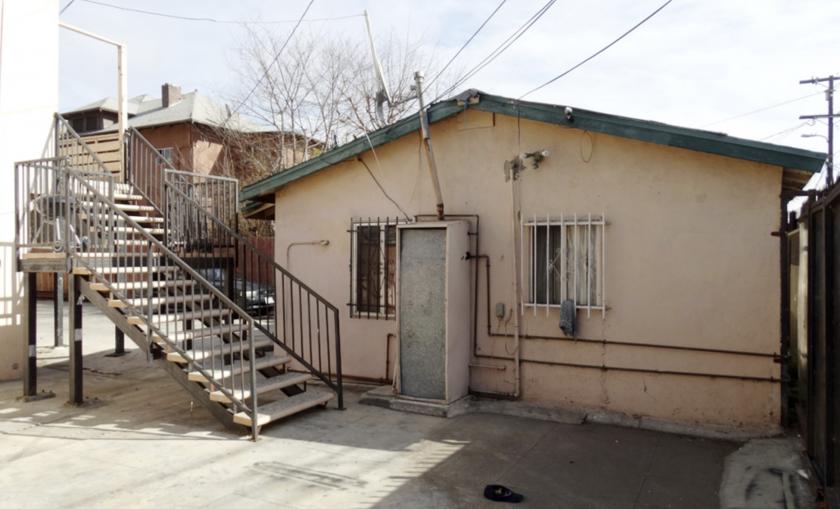
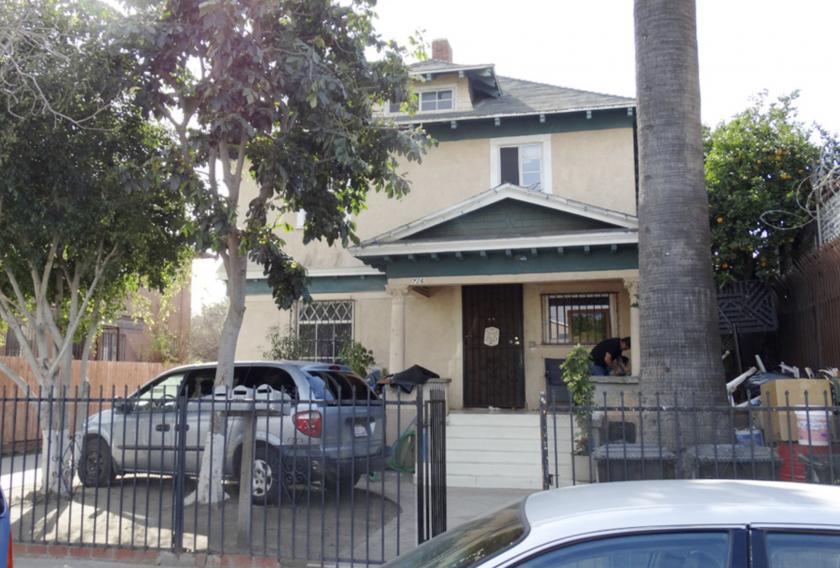
1-Mile | 3-Miles | 5-Miles | ||
---|---|---|---|---|
Total Population | 48,663 | 499,871 | 1,346,038 | |
Population Median Age | 32 | 34 | 35 | |
Population by Age | 0-9 Yrs | 7720 (15%) | 65033 (13%) | 175816 (13%) |
10-19 Yrs | 8072 (16%) | 70599 (14%) | 181559 (13%) | |
20-29 Yrs | 8819 (18%) | 103984 (20%) | 249334 (18%) | |
30-39 Yrs | 7296 (14%) | 80933 (16%) | 216356 (16%) | |
40-49 Yrs | 7259 (14%) | 63728 (12%) | 177301 (13%) | |
50-59 Yrs | 4606 (9%) | 51548 (10%) | 151207 (11%) | |
60-69 Yrs | 3013 (6%) | 34376 (6%) | 105493 (7%) | |
70+ Yrs | 1878 (3%) | 29670 (5%) | 88971 (6%) | |
Median HH Income | $41,325 | $36,946 | $42,628 | |
Total Household Income | < 24K | 3540 (30%) | 54938 (36%) | 126414 (30%) |
25-49K | 3554 (30%) | 38850 (25%) | 110419 (26%) | |
50-74K | 1928 (16%) | 21762 (14%) | 68485 (16%) | |
75-99K | 1088 (9%) | 13360 (8%) | 41786 (10%) | |
100-199K | 1311 (11%) | 18950 (12%) | 56798 (13%) | |
200K+ | 173 (1%) | 4499 (2%) | 13873 (3%) | |
Highest Education Level | No Diploma | 16008 | 134693 | 331698 |
Diploma or GED | 5707 | 66281 | 194281 | |
Some College | 3689 | 43281 | 134518 | |
Assoc. Degree | 925 | 13678 | 41844 | |
Bachelors Degree | 1627 | 38639 | 122281 | |
Higher Degree | 650 | 16382 | 47337 | |
Total Housing Units | 12,231 | 164,423 | 449,549 | |
--Owner-Occupied | 2,130 | 23,004 | 92,745 | |
--Renter-Occupied | 9,463 | 129,355 | 325,030 | |
Owner-Occupied Values | < 100K | 44 | 432 | 1773 |
100-199K | 56 | 850 | 2398 | |
200-299K | 360 | 2373 | 9875 | |
300-399K | 714 | 5402 | 20058 | |
400-499K | 433 | 4566 | 17941 | |
500K+ | 523 | 9381 | 40700 | |
Total Working Age Population | 36,077 | 395,428 | 1,064,040 | |
In Work Force | 23,871 | 247,842 | 682,098 | |
Not In Work Force | 12,206 | 147,585 | 381,942 | |
Workforce Employed | 21,928 | 228,189 | 632,780 | |
Workforce Unemployed | 1,939 | 19,572 | 49,190 | |
Civlian Workforce | 23,867 | 247,760 | 681,970 | |
Military Workforce | 4 | 82 | 128 | |
Total Households | 11,594 | 152,359 | 417,775 | |
Family Households | 8,908 | 87,503 | 259,388 | |
Non-Family Households | 2,685 | 64,856 | 158,387 | |
Married Couple | 4,808 | 44,775 | 141,297 | |
Other Family | 4,101 | 42,728 | 118,091 | |
Married w/Child | 2,484 | 21,060 | 64,584 | |
Single Male w/Child | 765 | 6,985 | 15,946 | |
Single Female w/Child | 1,515 | 14,664 | 38,986 |
Population Change Last Two Decades - Plus Projection
2000 | % | 2010 | % | 2020 | % | 2030 | |
---|---|---|---|---|---|---|---|
California | 33,871,648 | +10 | 37,253,956 | +9 | 40,467,295 | +8 | 43,631,295 |
Los Angeles County | 9,519,338 | +3 | 9,818,605 | +6 | 10,369,367 | +4 | 10,759,850 |
Total Working Age Population:
Total Households:
Total Working Age Population:
Total Households:
Total Working Age Population:
Total Households: