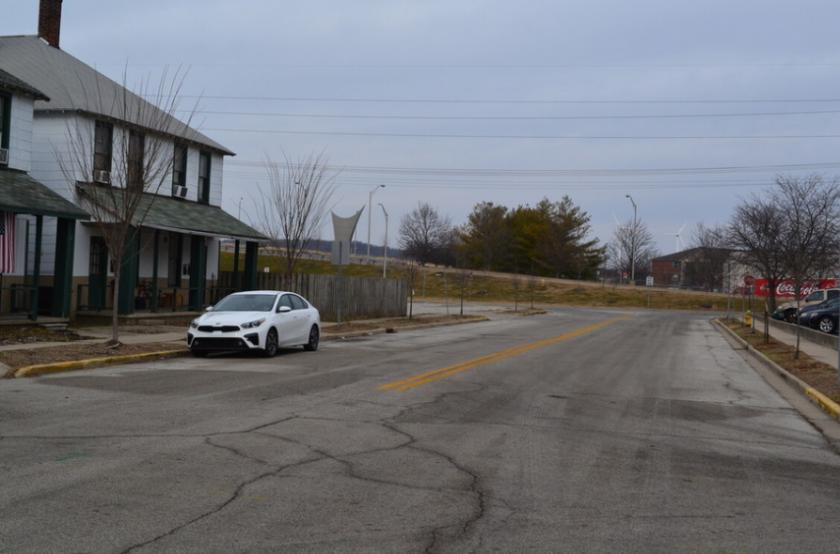
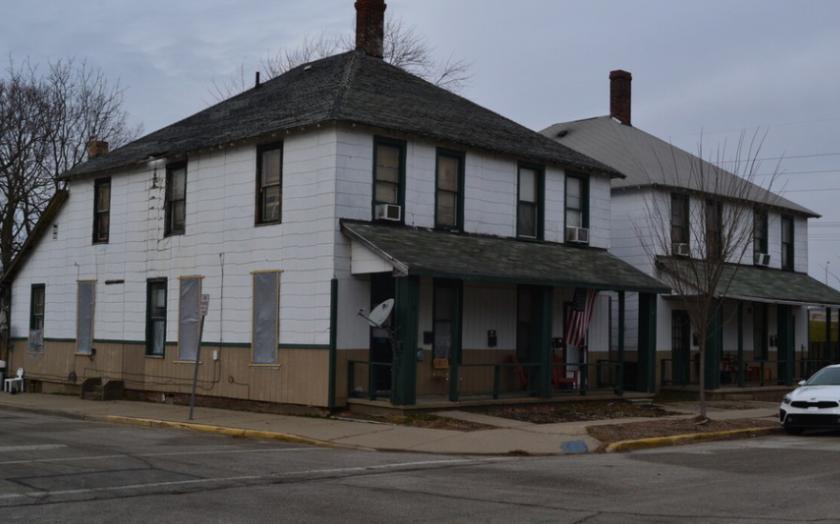
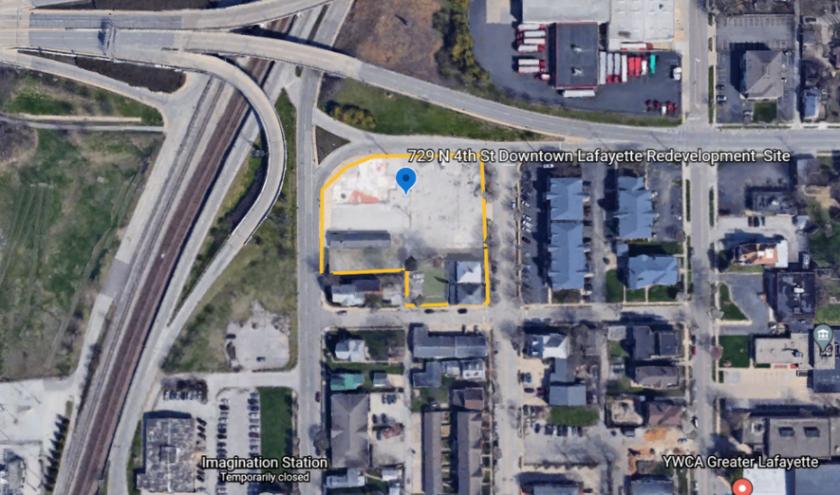
1-Mile | 3-Miles | 5-Miles | ||
---|---|---|---|---|
Total Population | 20,675 | 92,881 | 151,140 | |
Population Median Age | 30 | 32 | 33 | |
Population by Age | 0-9 Yrs | 1258 (6%) | 8198 (8%) | 16381 (10%) |
10-19 Yrs | 1312 (6%) | 16859 (18%) | 23947 (15%) | |
20-29 Yrs | 11832 (57%) | 30837 (33%) | 44673 (29%) | |
30-39 Yrs | 2174 (10%) | 10303 (11%) | 17572 (11%) | |
40-49 Yrs | 1417 (6%) | 7189 (7%) | 13399 (8%) | |
50-59 Yrs | 1212 (5%) | 7255 (7%) | 12988 (8%) | |
60-69 Yrs | 816 (3%) | 6061 (6%) | 11572 (7%) | |
70+ Yrs | 655 (3%) | 6178 (6%) | 10608 (7%) | |
Median HH Income | $27,269 | $39,848 | $46,668 | |
Total Household Income | < 24K | 4301 (47%) | 10985 (33%) | 15955 (28%) |
25-49K | 2576 (28%) | 9043 (27%) | 14062 (24%) | |
50-74K | 1060 (11%) | 5410 (16%) | 10566 (18%) | |
75-99K | 614 (6%) | 3211 (9%) | 5796 (10%) | |
100-199K | 386 (4%) | 3612 (10%) | 8121 (14%) | |
200K+ | 85 (0%) | 960 (2%) | 1887 (3%) | |
Highest Education Level | No Diploma | 841 | 4682 | 7345 |
Diploma or GED | 2108 | 11722 | 19749 | |
Some College | 1875 | 8656 | 15639 | |
Assoc. Degree | 484 | 2877 | 5539 | |
Bachelors Degree | 1591 | 8356 | 16521 | |
Higher Degree | 1867 | 9014 | 14941 | |
Total Housing Units | 10,333 | 36,867 | 61,419 | |
--Owner-Occupied | 1,717 | 14,137 | 26,404 | |
--Renter-Occupied | 7,305 | 19,083 | 29,983 | |
Owner-Occupied Values | < 100K | 779 | 5434 | 7069 |
100-199K | 625 | 5663 | 12254 | |
200-299K | 161 | 1864 | 4329 | |
300-399K | 86 | 588 | 1475 | |
400-499K | 23 | 330 | 717 | |
500K+ | 42 | 259 | 560 | |
Total Working Age Population | 19,032 | 80,171 | 125,879 | |
In Work Force | 11,768 | 47,600 | 79,665 | |
Not In Work Force | 7,265 | 32,571 | 46,213 | |
Workforce Employed | 11,178 | 45,303 | 76,004 | |
Workforce Unemployed | 561 | 2,233 | 3,561 | |
Civlian Workforce | 11,739 | 47,536 | 79,565 | |
Military Workforce | 29 | 64 | 100 | |
Total Households | 9,022 | 33,220 | 56,388 | |
Family Households | 2,048 | 14,601 | 27,903 | |
Non-Family Households | 6,975 | 18,619 | 28,484 | |
Married Couple | 1,261 | 9,685 | 19,796 | |
Other Family | 786 | 4,916 | 8,107 | |
Married w/Child | 468 | 3,960 | 8,400 | |
Single Male w/Child | 112 | 740 | 1,268 | |
Single Female w/Child | 331 | 2,046 | 3,424 |
Population Change Last Two Decades - Plus Projection
2000 | % | 2010 | % | 2020 | % | 2030 | |
---|---|---|---|---|---|---|---|
Indiana | 6,080,485 | +7 | 6,483,802 | +4 | 6,738,573 | +4 | 7,014,880 |
Tippecanoe County | 148,955 | +16 | 172,780 | +13 | 195,555 | +9 | 213,870 |
Total Working Age Population:
Total Households:
Total Working Age Population:
Total Households:
Total Working Age Population:
Total Households: