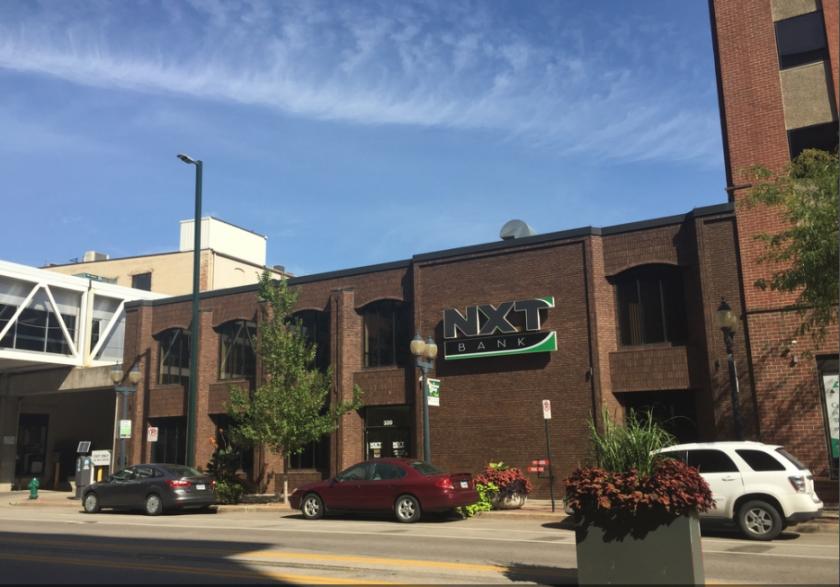
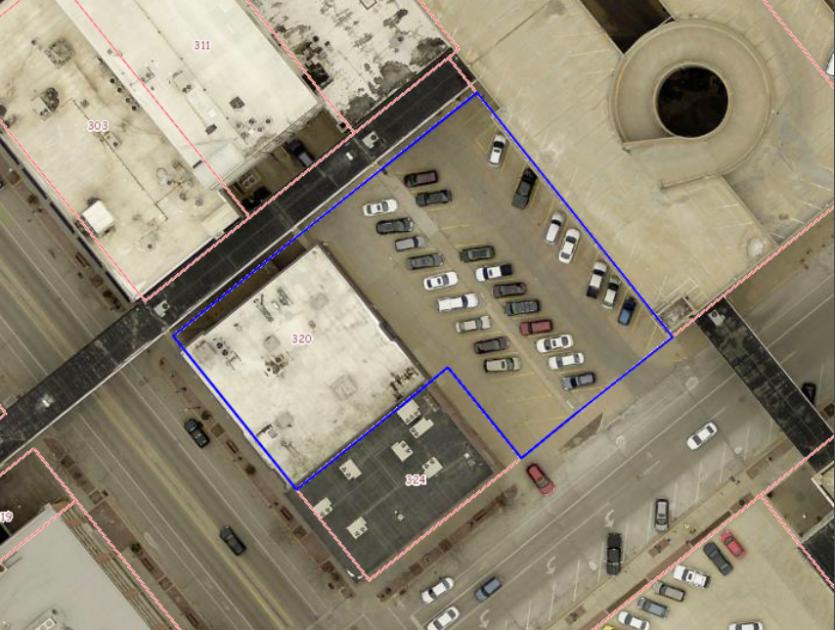
1-Mile | 3-Miles | 5-Miles | ||
---|---|---|---|---|
Total Population | 9,816 | 72,194 | 134,817 | |
Population Median Age | 35 | 38 | 38 | |
Population by Age | 0-9 Yrs | 1020 (10%) | 8868 (12%) | 16586 (12%) |
10-19 Yrs | 1603 (16%) | 8667 (12%) | 16727 (12%) | |
20-29 Yrs | 1858 (18%) | 11977 (16%) | 21586 (16%) | |
30-39 Yrs | 1493 (15%) | 10357 (14%) | 18886 (14%) | |
40-49 Yrs | 1220 (12%) | 7762 (10%) | 15683 (11%) | |
50-59 Yrs | 1126 (11%) | 8586 (11%) | 16343 (12%) | |
60-69 Yrs | 706 (7%) | 7915 (10%) | 14352 (10%) | |
70+ Yrs | 790 (8%) | 8063 (11%) | 14655 (10%) | |
Median HH Income | $43,556 | $53,980 | $56,930 | |
Total Household Income | < 24K | 989 (26%) | 6073 (19%) | 10471 (18%) |
25-49K | 1074 (28%) | 7949 (26%) | 14426 (25%) | |
50-74K | 777 (20%) | 6711 (21%) | 11876 (20%) | |
75-99K | 493 (13%) | 4067 (13%) | 7839 (13%) | |
100-199K | 318 (8%) | 4996 (16%) | 10612 (18%) | |
200K+ | 93 (2%) | 767 (2%) | 1958 (3%) | |
Highest Education Level | No Diploma | 761 | 3813 | 6395 |
Diploma or GED | 1947 | 14224 | 25320 | |
Some College | 1544 | 11274 | 20813 | |
Assoc. Degree | 659 | 6102 | 10992 | |
Bachelors Degree | 873 | 9729 | 19971 | |
Higher Degree | 275 | 3604 | 7464 | |
Total Housing Units | 4,276 | 33,003 | 61,889 | |
--Owner-Occupied | 1,984 | 20,666 | 38,174 | |
--Renter-Occupied | 1,760 | 9,897 | 19,006 | |
Owner-Occupied Values | < 100K | 1143 | 5522 | 8821 |
100-199K | 695 | 12265 | 21301 | |
200-299K | 88 | 1880 | 5355 | |
300-399K | 22 | 430 | 1258 | |
400-499K | 22 | 244 | 670 | |
500K+ | 16 | 325 | 768 | |
Total Working Age Population | 8,121 | 58,506 | 108,447 | |
In Work Force | 5,097 | 39,559 | 75,054 | |
Not In Work Force | 3,024 | 18,947 | 33,393 | |
Workforce Employed | 4,723 | 37,645 | 71,933 | |
Workforce Unemployed | 372 | 1,902 | 3,093 | |
Civlian Workforce | 5,095 | 39,547 | 75,026 | |
Military Workforce | 2 | 12 | 28 | |
Total Households | 3,745 | 30,563 | 57,181 | |
Family Households | 1,791 | 16,569 | 31,773 | |
Non-Family Households | 1,954 | 13,994 | 25,408 | |
Married Couple | 986 | 11,551 | 23,188 | |
Other Family | 805 | 5,018 | 8,585 | |
Married w/Child | 425 | 4,256 | 8,993 | |
Single Male w/Child | 86 | 869 | 1,568 | |
Single Female w/Child | 415 | 2,386 | 4,083 |
Population Change Last Two Decades - Plus Projection
2000 | % | 2010 | % | 2020 | % | 2030 | |
---|---|---|---|---|---|---|---|
Iowa | 2,926,324 | +4 | 3,046,355 | -100 | |||
Linn County | 191,701 | +10 | 211,226 | -100 |
Total Working Age Population:
Total Households:
Total Working Age Population:
Total Households:
Total Working Age Population:
Total Households: