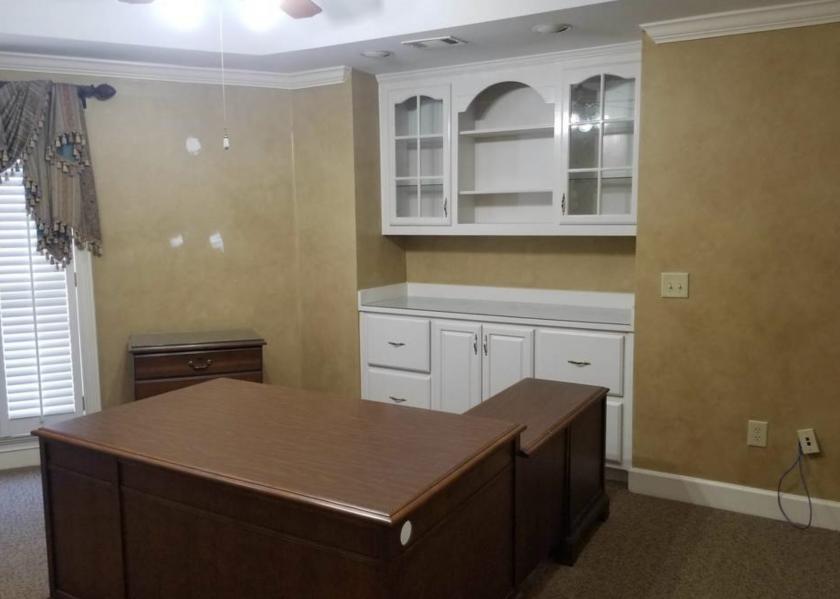
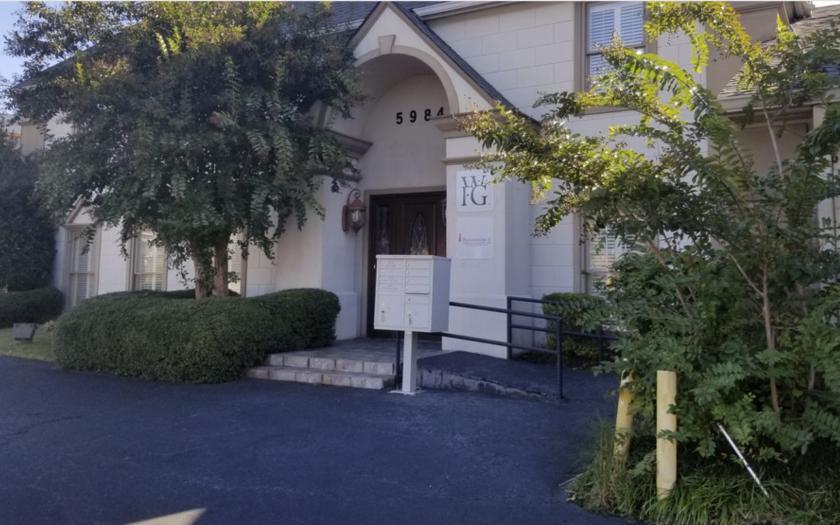
1-Mile | 3-Miles | 5-Miles | ||
---|---|---|---|---|
Total Population | 18,961 | 108,797 | 241,492 | |
Population Median Age | 30 | 32 | 34 | |
Population by Age | 0-9 Yrs | 3500 (18%) | 17584 (16%) | 35848 (14%) |
10-19 Yrs | 2704 (14%) | 16825 (15%) | 34578 (14%) | |
20-29 Yrs | 3555 (18%) | 18165 (16%) | 38555 (15%) | |
30-39 Yrs | 3798 (20%) | 18923 (17%) | 39784 (16%) | |
40-49 Yrs | 2311 (12%) | 14332 (13%) | 32161 (13%) | |
50-59 Yrs | 1715 (9%) | 11075 (10%) | 28409 (11%) | |
60-69 Yrs | 943 (4%) | 6760 (6%) | 18088 (7%) | |
70+ Yrs | 436 (2%) | 5132 (4%) | 14068 (5%) | |
Median HH Income | $41,016 | $47,949 | $53,085 | |
Total Household Income | < 24K | 1644 (26%) | 7289 (20%) | 15860 (18%) |
25-49K | 2039 (32%) | 11518 (31%) | 23760 (28%) | |
50-74K | 1420 (22%) | 7733 (21%) | 17182 (20%) | |
75-99K | 584 (9%) | 3690 (10%) | 9639 (11%) | |
100-199K | 527 (8%) | 5013 (13%) | 14231 (16%) | |
200K+ | 51 (0%) | 937 (2%) | 3495 (4%) | |
Highest Education Level | No Diploma | 4176 | 18217 | 33127 |
Diploma or GED | 3195 | 17317 | 36623 | |
Some College | 1136 | 9739 | 23636 | |
Assoc. Degree | 940 | 5034 | 11870 | |
Bachelors Degree | 1128 | 10606 | 31142 | |
Higher Degree | 534 | 5801 | 18148 | |
Total Housing Units | 6,799 | 39,062 | 90,874 | |
--Owner-Occupied | 1,727 | 14,755 | 38,484 | |
--Renter-Occupied | 4,538 | 21,426 | 45,684 | |
Owner-Occupied Values | < 100K | 282 | 2234 | 4637 |
100-199K | 1027 | 6657 | 15057 | |
200-299K | 370 | 3271 | 9517 | |
300-399K | 34 | 1926 | 6252 | |
400-499K | 0 | 371 | 1786 | |
500K+ | 13 | 296 | 1233 | |
Total Working Age Population | 13,830 | 80,534 | 183,567 | |
In Work Force | 10,069 | 57,645 | 130,128 | |
Not In Work Force | 3,761 | 22,889 | 53,439 | |
Workforce Employed | 9,866 | 55,419 | 124,914 | |
Workforce Unemployed | 176 | 2,150 | 5,124 | |
Civlian Workforce | 10,043 | 57,569 | 130,038 | |
Military Workforce | 27 | 76 | 90 | |
Total Households | 6,265 | 36,180 | 84,168 | |
Family Households | 3,911 | 23,450 | 52,986 | |
Non-Family Households | 2,354 | 12,731 | 31,182 | |
Married Couple | 2,170 | 14,754 | 35,978 | |
Other Family | 1,741 | 8,695 | 17,007 | |
Married w/Child | 1,212 | 7,762 | 17,572 | |
Single Male w/Child | 192 | 1,360 | 2,520 | |
Single Female w/Child | 908 | 3,702 | 6,690 |
Population Change Last Two Decades - Plus Projection
2000 | % | 2010 | % | 2020 | % | 2030 | |
---|---|---|---|---|---|---|---|
Georgia | 8,186,453 | +18 | 9,687,653 | +12 | 10,833,472 | +13 | 12,292,423 |
DeKalb County | 665,865 | +4 | 691,893 | +15 | 793,154 | +19 | 944,045 |
Fulton County | 816,006 | +13 | 920,581 | +19 | 1,099,181 | +18 | 1,300,861 |
Gwinnett County | 588,448 | +37 | 805,321 | +21 | 971,145 | +21 | 1,175,358 |
Total Working Age Population:
Total Households:
Total Working Age Population:
Total Households:
Total Working Age Population:
Total Households: