Industrial Properties
165 Bedell Avenue Highland, NY 12528
165 Bedell Avenue Highland, NY 12528
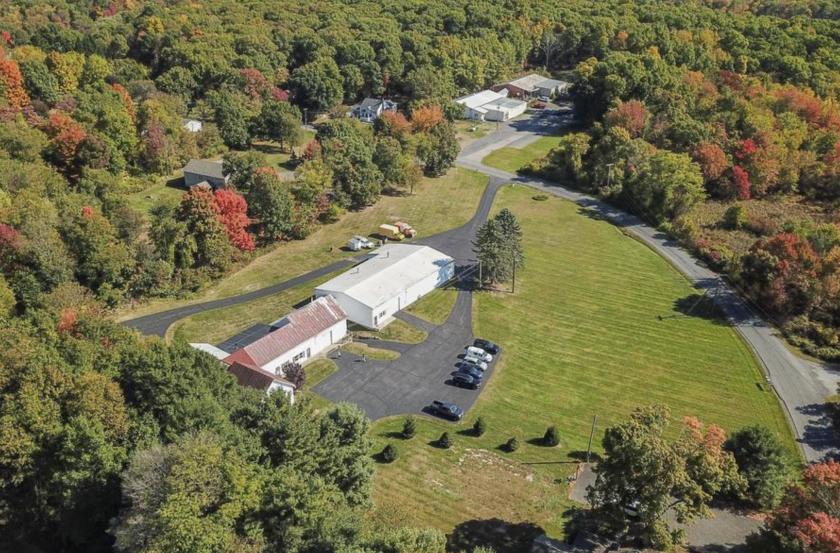
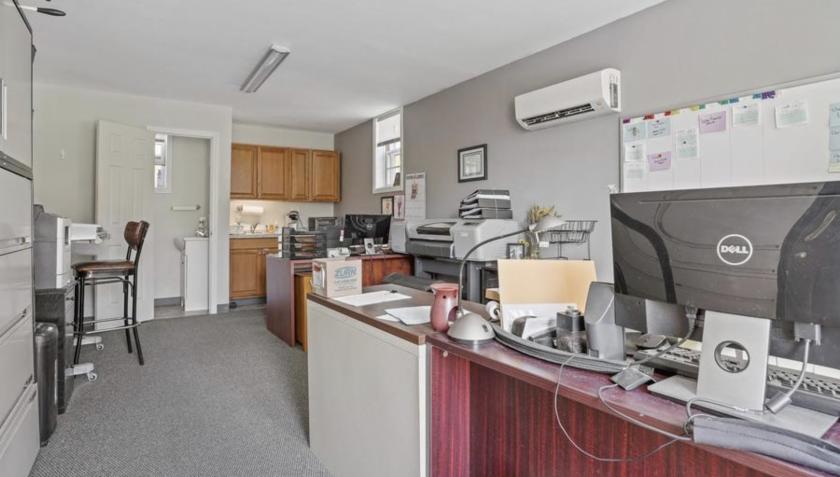
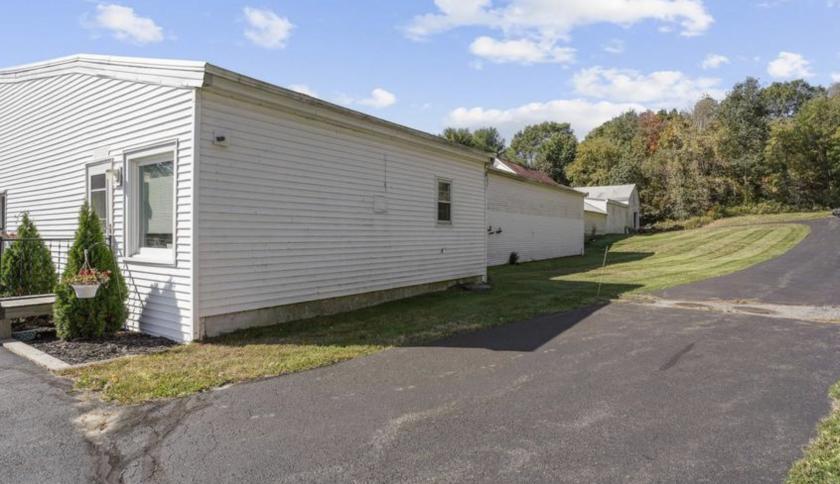
Details & Description
Listing Agents

Nathan Kanney
KW Commercial
O: 845-430-8314
nate.kanney@kw.com
KW Commercial
O: 845-430-8314
nate.kanney@kw.com
While we strive to provide the most accurate information, all listing information, and demographic data, is provided by third-parties. As such, MyEListing will not be responsible for the accuracy of the information. It is strongly recommended that you verify all information with the listing agent, and any relevant agencies, prior to making any decisions.