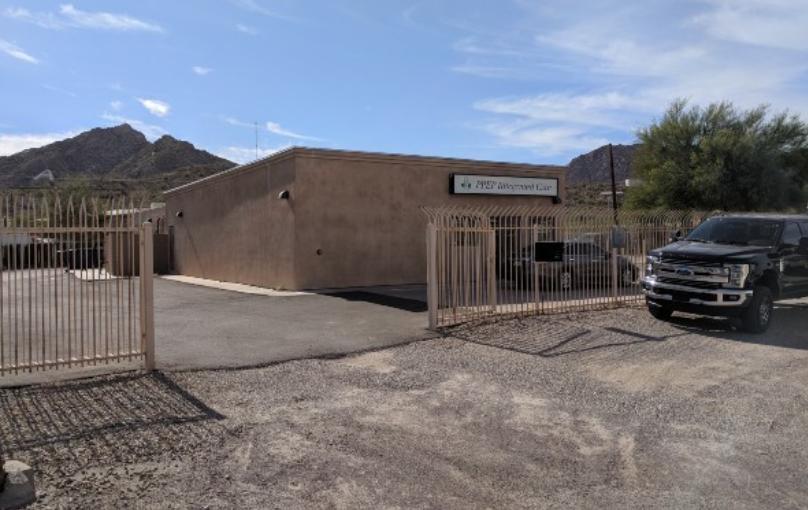
Retail Space
1041 Solana Avenue Ajo, AZ 85321
1041 Solana Avenue Ajo, AZ 85321
Details & Description
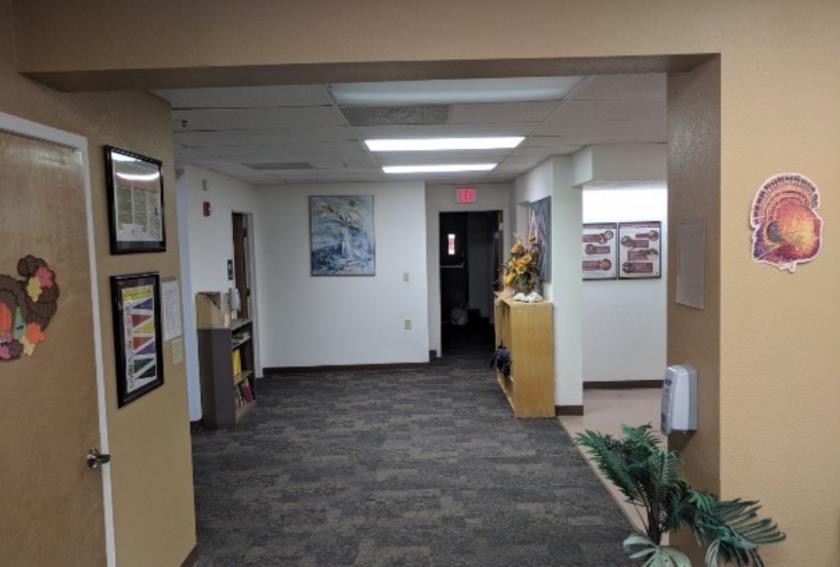
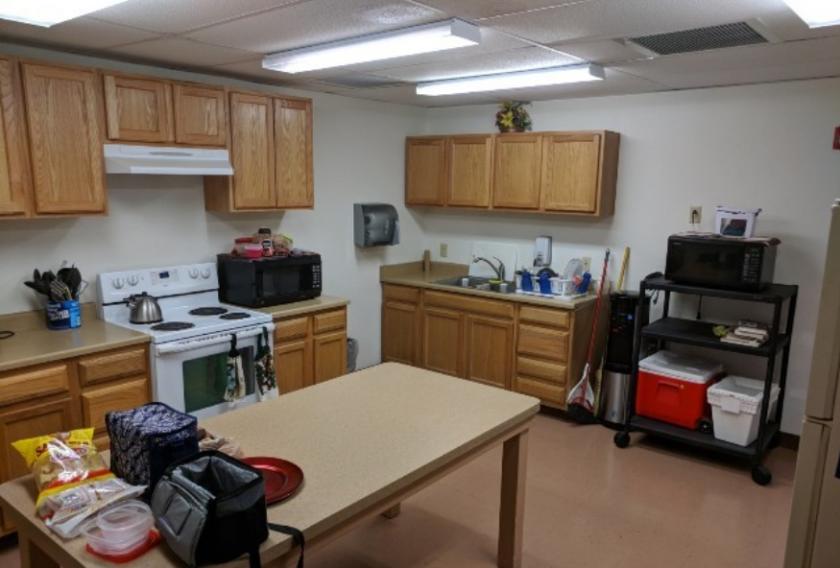
Property Highlights
- • Located on main commercial corridor
- • Secure lot
- • Fire sprinklers
- • Versatile-multi-use building
Listing Agents

Jon Hammond
KW Commercial
O: 480-283-3740
jhammond@kwcommercial.com
KW Commercial
O: 480-283-3740
jhammond@kwcommercial.com
While we strive to provide the most accurate information, all listing information, and demographic data, is provided by third-parties. As such, MyEListing will not be responsible for the accuracy of the information. It is strongly recommended that you verify all information with the listing agent, and any relevant agencies, prior to making any decisions.