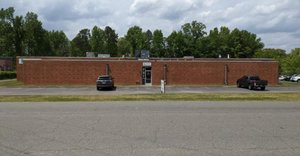
1-Mile | 3-Miles | 5-Miles | ||
---|---|---|---|---|
Total Population | 6,535 | 85,794 | 241,499 | |
Population Median Age | 37 | 36 | 35 | |
Population by Age | 0-9 Yrs | 792 (12%) | 8307 (9%) | 29974 (12%) |
10-19 Yrs | 720 (11%) | 8029 (9%) | 28717 (11%) | |
20-29 Yrs | 1162 (17%) | 20536 (23%) | 46118 (19%) | |
30-39 Yrs | 1172 (17%) | 17351 (20%) | 43186 (17%) | |
40-49 Yrs | 642 (9%) | 9637 (11%) | 29752 (12%) | |
50-59 Yrs | 867 (13%) | 9306 (10%) | 27699 (11%) | |
60-69 Yrs | 652 (9%) | 7637 (8%) | 20262 (8%) | |
70+ Yrs | 529 (8%) | 4989 (5%) | 15790 (6%) | |
Median HH Income | $29,650 | $55,558 | $50,805 | |
Total Household Income | < 24K | 1228 (43%) | 9360 (23%) | 24144 (24%) |
25-49K | 854 (30%) | 8859 (22%) | 25203 (25%) | |
50-74K | 344 (12%) | 6030 (15%) | 16536 (16%) | |
75-99K | 205 (7%) | 4212 (10%) | 10279 (10%) | |
100-199K | 152 (5%) | 7504 (19%) | 15870 (15%) | |
200K+ | 61 (2%) | 3510 (8%) | 7960 (7%) | |
Highest Education Level | No Diploma | 702 | 7699 | 25248 |
Diploma or GED | 1347 | 9949 | 31398 | |
Some College | 1082 | 11826 | 33664 | |
Assoc. Degree | 450 | 4191 | 12125 | |
Bachelors Degree | 720 | 17802 | 40233 | |
Higher Degree | 254 | 9851 | 22417 | |
Total Housing Units | 3,144 | 45,217 | 112,167 | |
--Owner-Occupied | 1,017 | 15,335 | 41,943 | |
--Renter-Occupied | 1,826 | 24,140 | 58,048 | |
Owner-Occupied Values | < 100K | 319 | 3093 | 8492 |
100-199K | 296 | 3834 | 14400 | |
200-299K | 267 | 2657 | 5525 | |
300-399K | 85 | 2244 | 3693 | |
400-499K | 35 | 1219 | 2285 | |
500K+ | 15 | 2288 | 7547 | |
Total Working Age Population | 5,309 | 72,945 | 193,902 | |
In Work Force | 3,236 | 53,381 | 137,924 | |
Not In Work Force | 2,073 | 19,563 | 55,978 | |
Workforce Employed | 2,934 | 50,599 | 130,219 | |
Workforce Unemployed | 303 | 2,777 | 7,627 | |
Civlian Workforce | 3,236 | 53,376 | 137,846 | |
Military Workforce | 0 | 5 | 78 | |
Total Households | 2,843 | 39,475 | 99,991 | |
Family Households | 1,260 | 15,880 | 48,854 | |
Non-Family Households | 1,583 | 23,596 | 51,137 | |
Married Couple | 426 | 9,581 | 28,640 | |
Other Family | 834 | 6,298 | 20,215 | |
Married w/Child | 139 | 3,210 | 11,092 | |
Single Male w/Child | 51 | 585 | 1,880 | |
Single Female w/Child | 309 | 2,412 | 8,803 |
Population Change Last Two Decades - Plus Projection
2000 | % | 2010 | % | 2020 | % | 2030 | |
---|---|---|---|---|---|---|---|
North Carolina | 8,049,313 | +18 | 9,535,483 | +11 | 10,630,691 | +11 | 11,836,070 |
Cabarrus County | 131,063 | +36 | 178,011 | +22 | 216,608 | +20 | 259,075 |
Mecklenburg County | 695,454 | +32 | 919,628 | +23 | 1,131,342 | +19 | 1,348,822 |
Union County | 123,677 | +63 | 201,292 | +21 | 242,657 | +25 | 302,410 |
Total Working Age Population:
Total Households:
Total Working Age Population:
Total Households:
Total Working Age Population:
Total Households: