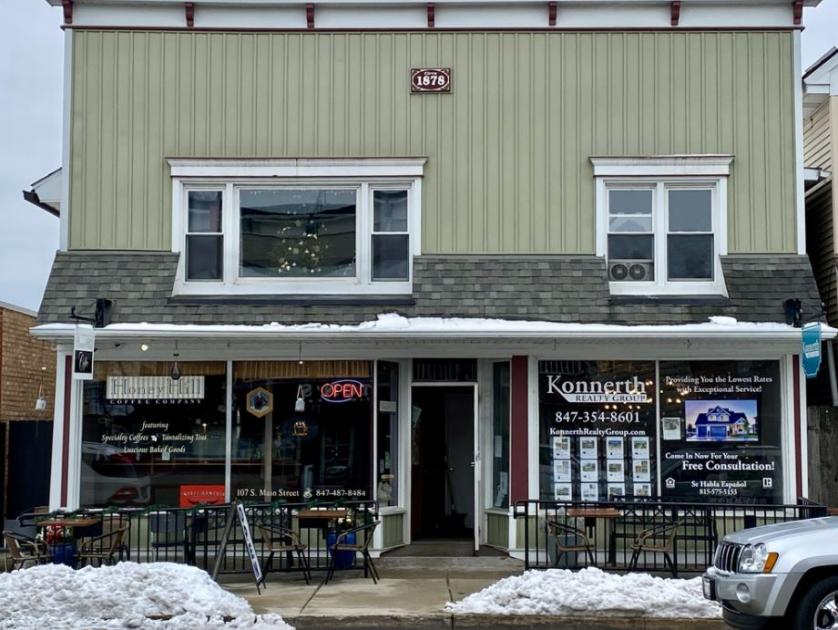
Retail Space
107 South Main Street Wauconda, IL 60084
107 South Main Street Wauconda, IL 60084
Details & Description
Property Highlights
- • Great location in Center of Downtown Wauconda
- • 100 leased-$68k Annual Income
- • 35 frontage on Main St
- • Walking distance to Bangs Lake
- • Contact Listing Broker for Details
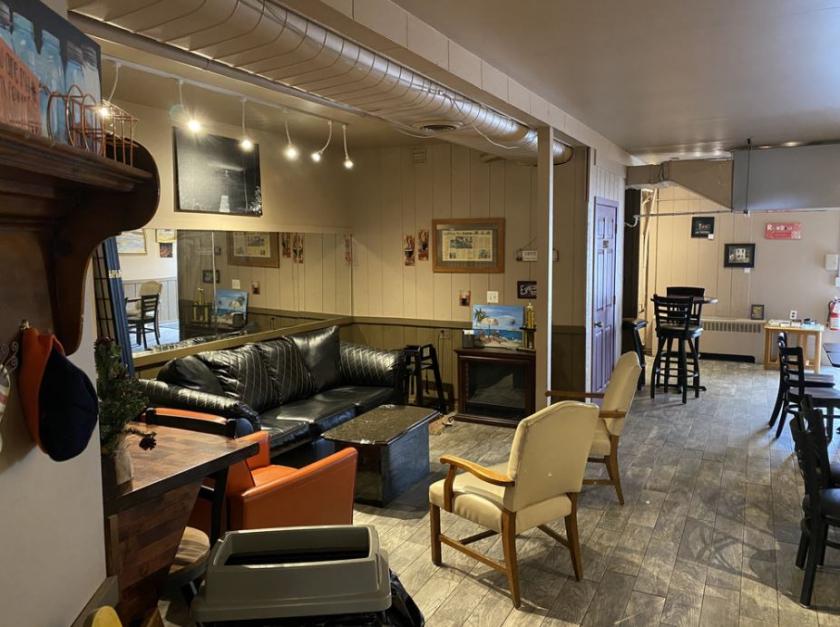
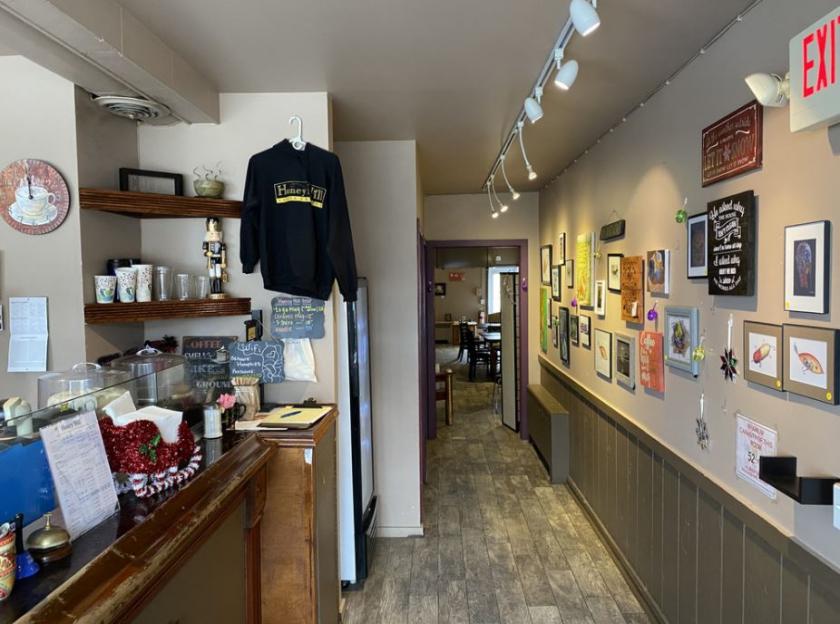
Additional Photos

Listing Agents

Joseph Heffernan
KW Commercial
O: 847-302-5550
M: 847-302-5550
joeh@kwcommercial.com
KW Commercial
O: 847-302-5550
M: 847-302-5550
joeh@kwcommercial.com
While we strive to provide the most accurate information, all listing information, and demographic data, is provided by third-parties. As such, MyEListing will not be responsible for the accuracy of the information. It is strongly recommended that you verify all information with the listing agent, and any relevant agencies, prior to making any decisions.


