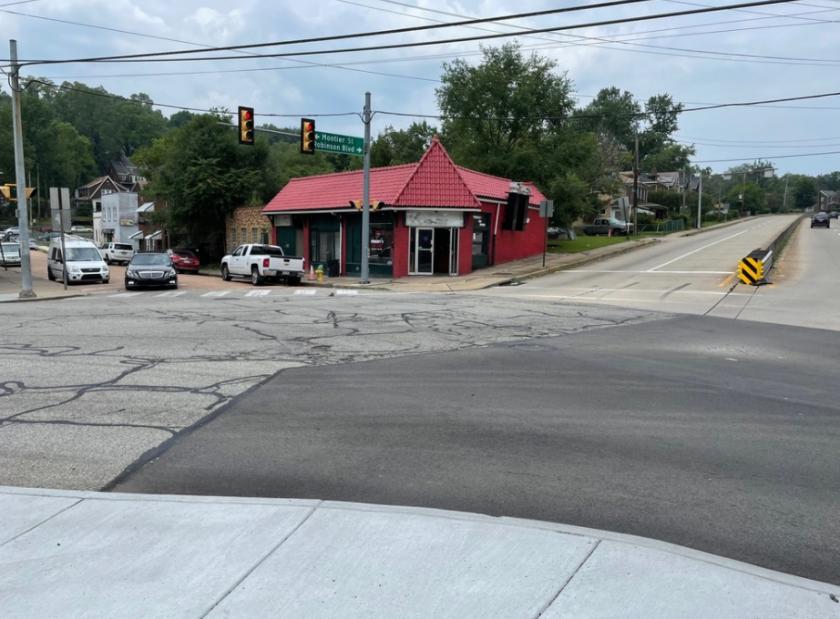
Retail Space
1695 Laketon Road Pittsburgh, PA 15221
1695 Laketon Road Pittsburgh, PA 15221
Details & Description
Property Highlights
• Great take out business with additional space available for expansion or rented for additional income.
• Expansion opportunity as a satellite restaurant or a new owner investment.
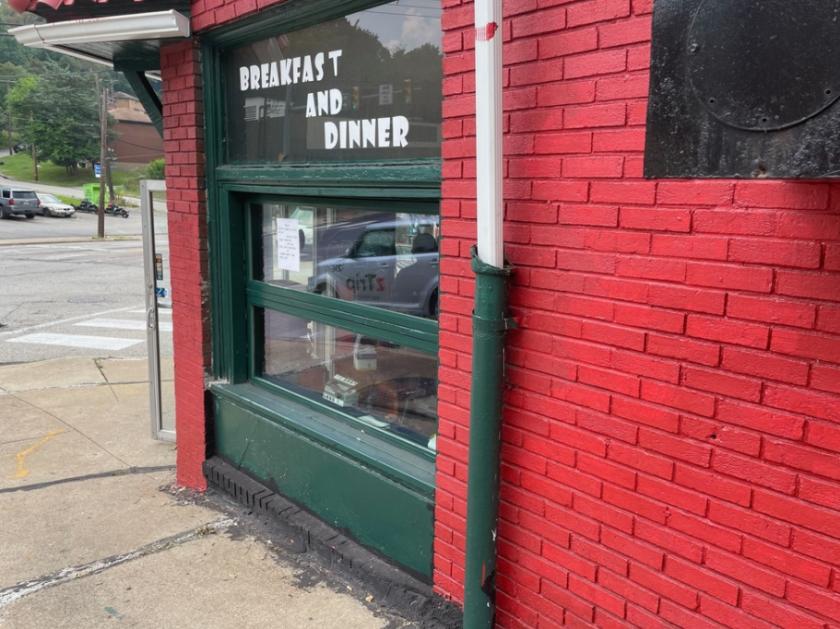
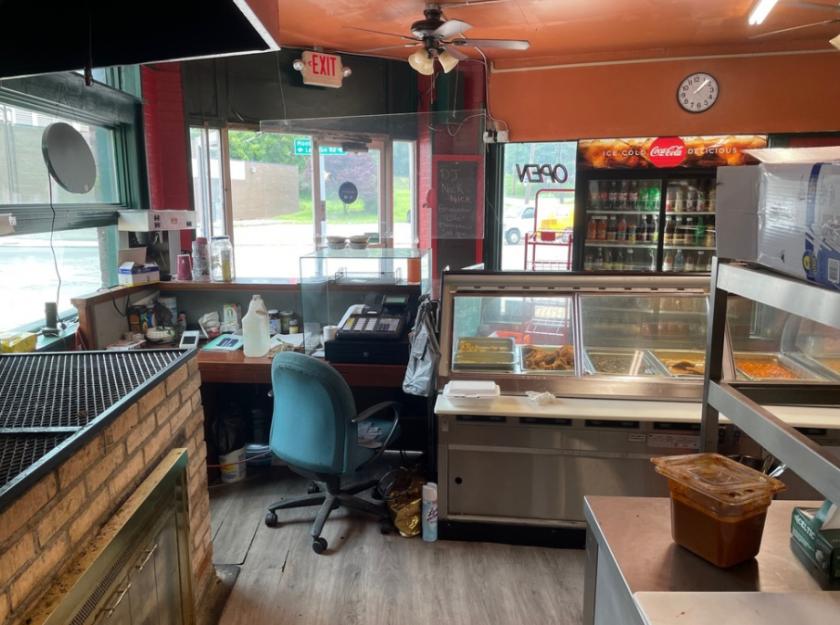
Additional Photos


Listing Agents

Bill Forde
KW Commercial
O: 412-854-4000
M: 412-439-0429
bforde@kwcommercial.com
KW Commercial
O: 412-854-4000
M: 412-439-0429
bforde@kwcommercial.com
While we strive to provide the most accurate information, all listing information, and demographic data, is provided by third-parties. As such, MyEListing will not be responsible for the accuracy of the information. It is strongly recommended that you verify all information with the listing agent, and any relevant agencies, prior to making any decisions.


