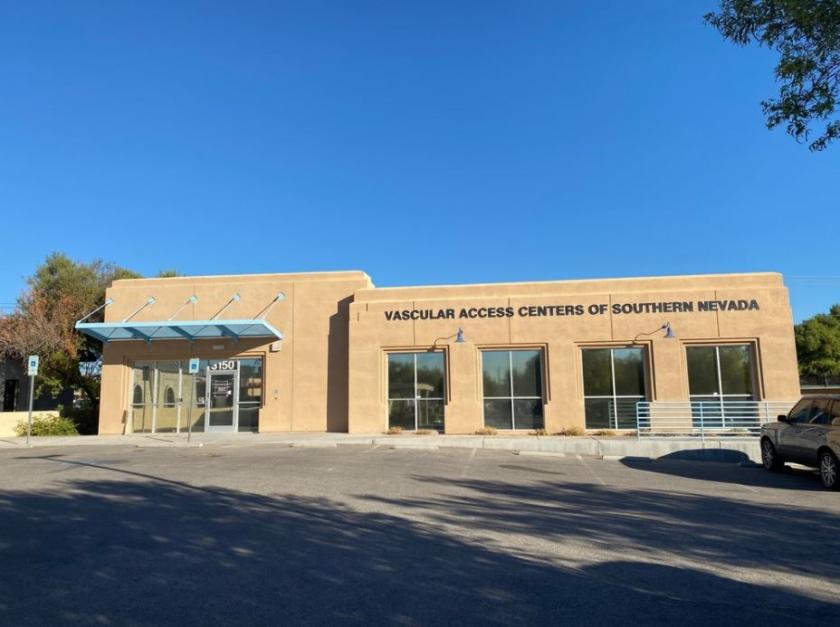
Office Space
3150 West Charleston Boulevard Las Vegas, NV 89102
3150 West Charleston Boulevard Las Vegas, NV 89102
Details & Description
Property Highlights
- • High traffic area on W Charleston
- • 4,800 Medical Office - building
- • Stand alone building
- • Onsite parking - 51 parking ratio
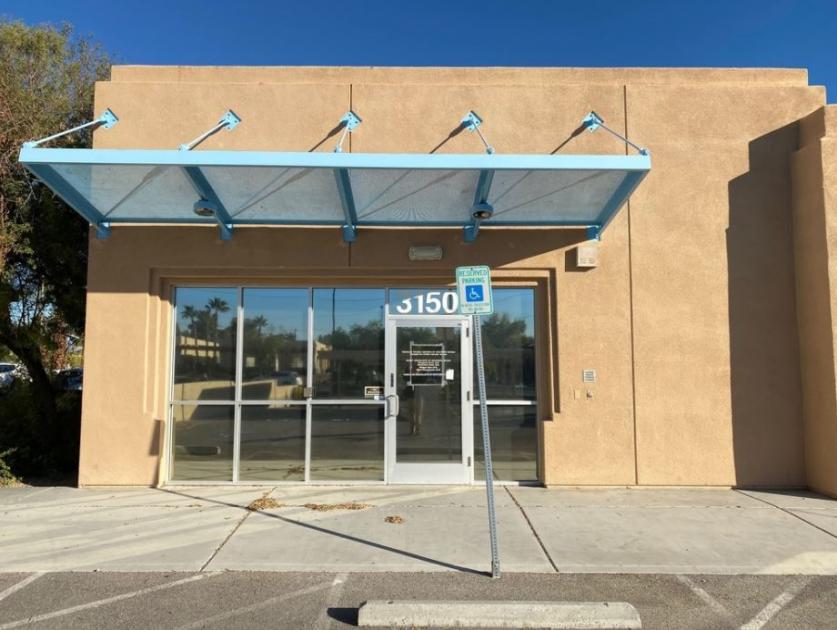
- • Covered parking available
- • Monument building signage available
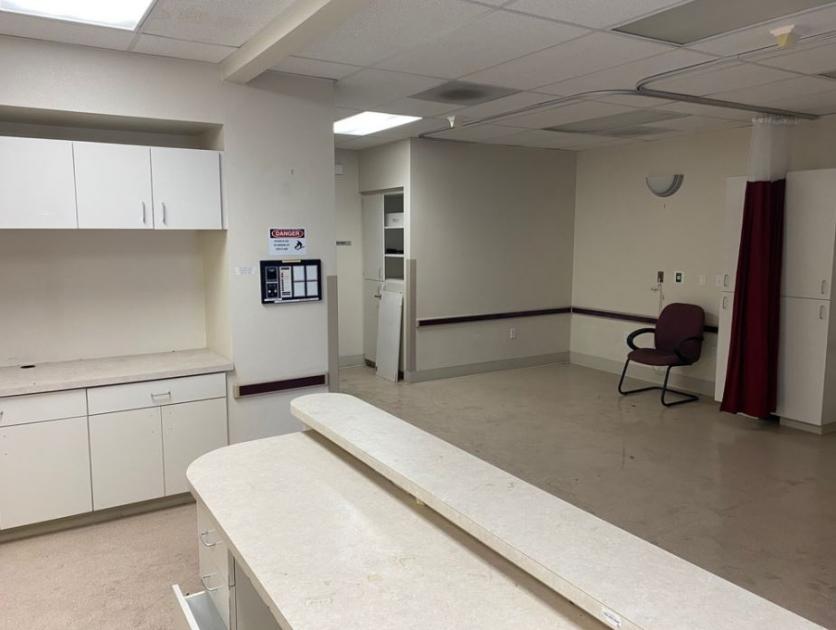
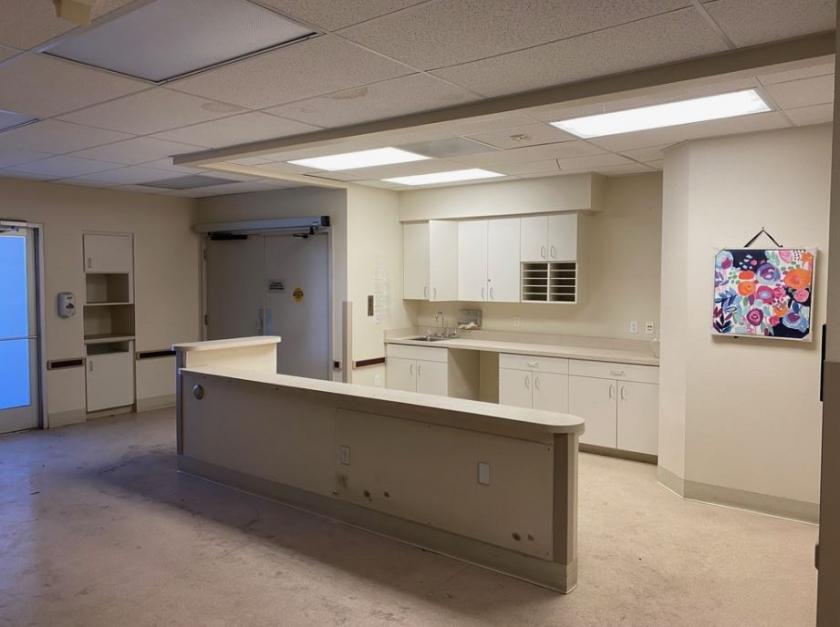
Additional Photos
Listing Agents

Kim Henry
O: 702-301-4275
kimhenry@kwcommercial.com
O: 702-301-4275
kimhenry@kwcommercial.com
While we strive to provide the most accurate information, all listing information, and demographic data, is provided by third-parties. As such, MyEListing will not be responsible for the accuracy of the information. It is strongly recommended that you verify all information with the listing agent, and any relevant agencies, prior to making any decisions.


