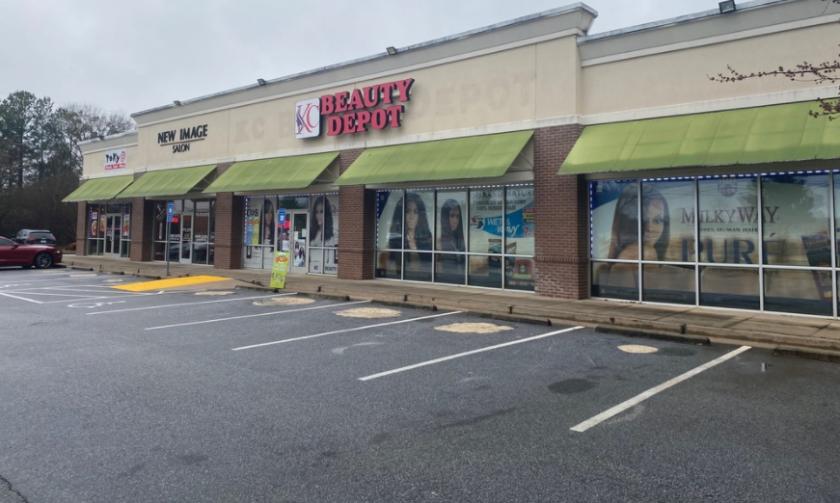
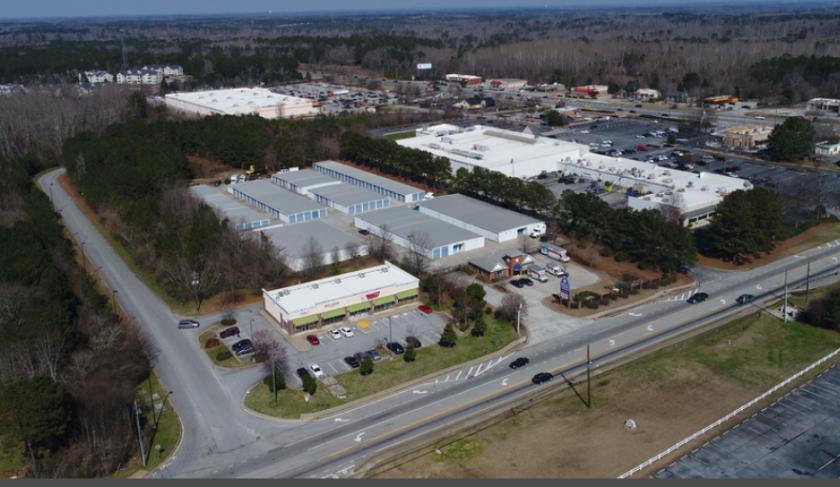
Retail Space
1940 McDonough Road Hampton, GA 30228
1940 McDonough Road Hampton, GA 30228
Details & Description
Property Highlights
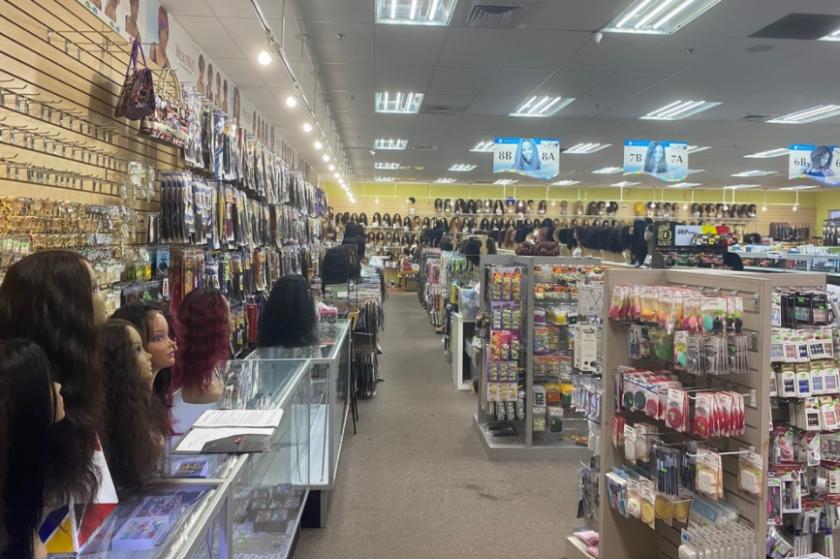
- • Owner User Retail Strip center For Sale.
- • Income from existing 2 tenants.
- • Great Location
Listing Agents

Patrick Hallwood
KW Commercial
O: 404-663-7291
M: 404-242-6500
patrickhallwood@kw.com
KW Commercial
O: 404-663-7291
M: 404-242-6500
patrickhallwood@kw.com
While we strive to provide the most accurate information, all listing information, and demographic data, is provided by third-parties. As such, MyEListing will not be responsible for the accuracy of the information. It is strongly recommended that you verify all information with the listing agent, and any relevant agencies, prior to making any decisions.