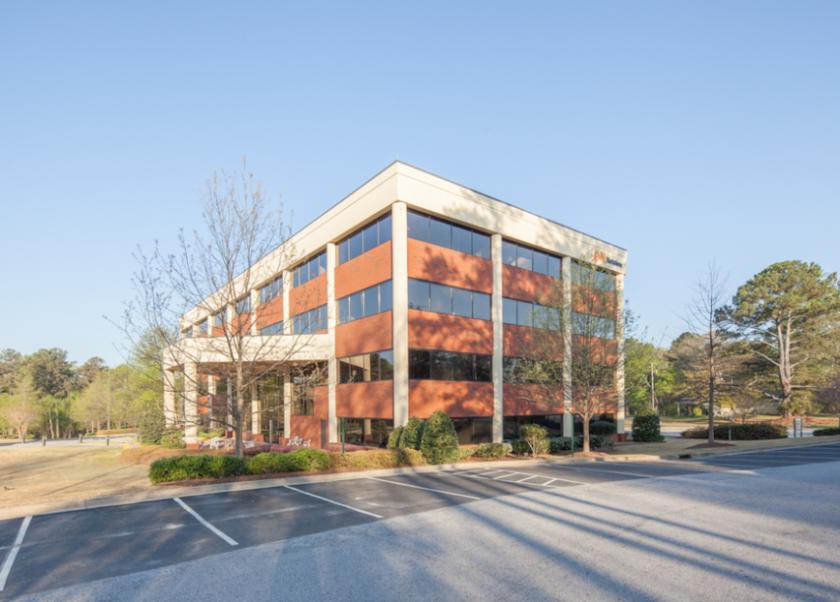
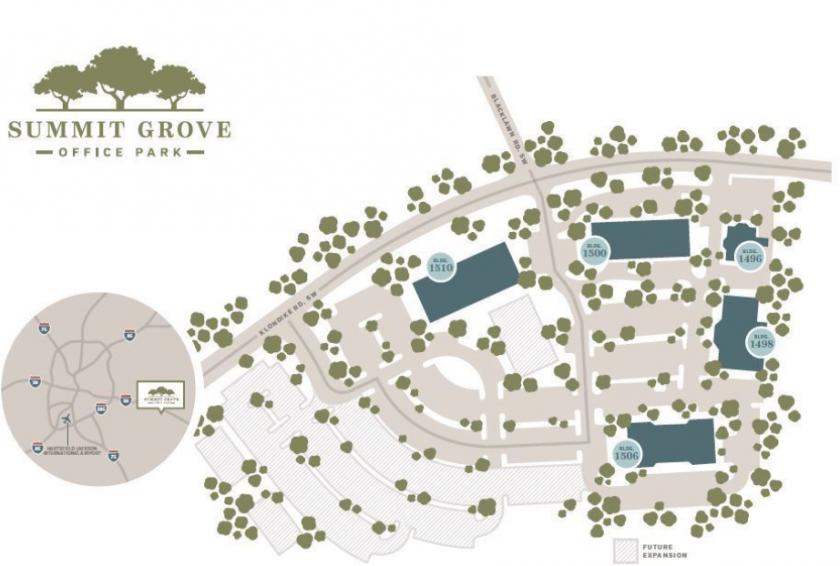
1-Mile | 3-Miles | 5-Miles | ||
---|---|---|---|---|
Total Population | 2,108 | 33,740 | 75,232 | |
Population Median Age | 38 | 35 | 36 | |
Population by Age | 0-9 Yrs | 297 (14%) | 4771 (14%) | 10337 (13%) |
10-19 Yrs | 343 (16%) | 5651 (16%) | 11892 (15%) | |
20-29 Yrs | 200 (9%) | 4769 (14%) | 10318 (13%) | |
30-39 Yrs | 234 (11%) | 4502 (13%) | 9485 (12%) | |
40-49 Yrs | 396 (18%) | 4198 (12%) | 9817 (13%) | |
50-59 Yrs | 203 (9%) | 3821 (11%) | 9623 (12%) | |
60-69 Yrs | 130 (6%) | 3318 (9%) | 8044 (10%) | |
70+ Yrs | 307 (14%) | 2710 (8%) | 5717 (7%) | |
Median HH Income | $45,363 | $48,626 | $54,874 | |
Total Household Income | < 24K | 201 (26%) | 2873 (24%) | 5214 (19%) |
25-49K | 217 (29%) | 3112 (26%) | 6902 (25%) | |
50-74K | 103 (13%) | 2067 (17%) | 5081 (19%) | |
75-99K | 49 (6%) | 1278 (10%) | 3259 (12%) | |
100-199K | 155 (20%) | 1949 (16%) | 5323 (19%) | |
200K+ | 22 (2%) | 411 (3%) | 949 (3%) | |
Highest Education Level | No Diploma | 329 | 3443 | 5965 |
Diploma or GED | 480 | 6557 | 13955 | |
Some College | 157 | 4239 | 10487 | |
Assoc. Degree | 97 | 1785 | 4944 | |
Bachelors Degree | 255 | 3462 | 8389 | |
Higher Degree | 51 | 1556 | 4290 | |
Total Housing Units | 906 | 12,938 | 29,299 | |
--Owner-Occupied | 421 | 6,068 | 15,149 | |
--Renter-Occupied | 326 | 5,621 | 11,578 | |
Owner-Occupied Values | < 100K | 57 | 1620 | 3742 |
100-199K | 144 | 2744 | 6323 | |
200-299K | 177 | 1111 | 3407 | |
300-399K | 27 | 387 | 1121 | |
400-499K | 14 | 145 | 379 | |
500K+ | 1 | 61 | 177 | |
Total Working Age Population | 1,556 | 25,452 | 57,372 | |
In Work Force | 967 | 15,834 | 36,462 | |
Not In Work Force | 589 | 9,618 | 20,910 | |
Workforce Employed | 899 | 14,721 | 33,997 | |
Workforce Unemployed | 69 | 1,104 | 2,426 | |
Civlian Workforce | 967 | 15,825 | 36,423 | |
Military Workforce | 0 | 9 | 40 | |
Total Households | 747 | 11,689 | 26,727 | |
Family Households | 537 | 8,104 | 18,197 | |
Non-Family Households | 210 | 3,585 | 8,529 | |
Married Couple | 323 | 4,458 | 10,786 | |
Other Family | 214 | 3,646 | 7,412 | |
Married w/Child | 140 | 1,851 | 4,170 | |
Single Male w/Child | 0 | 418 | 862 | |
Single Female w/Child | 121 | 1,758 | 3,527 |
Population Change Last Two Decades - Plus Projection
2000 | % | 2010 | % | 2020 | % | 2030 | |
---|---|---|---|---|---|---|---|
Georgia | 8,186,453 | +18 | 9,687,653 | +12 | 10,833,472 | +13 | 12,292,423 |
DeKalb County | 665,865 | +4 | 691,893 | +15 | 793,154 | +19 | 944,045 |
Fulton County | 816,006 | +13 | 920,581 | +19 | 1,099,181 | +18 | 1,300,861 |
Henry County | 119,341 | +71 | 203,922 | +18 | 239,866 | +20 | 286,950 |
Newton County | 62,001 | +61 | 99,958 | +12 | 112,354 | +15 | 128,770 |
Rockdale County | 70,111 | +22 | 85,215 | +11 | 94,960 | +18 | 112,165 |
Walton County | 60,687 | +38 | 83,768 | +14 | 95,814 | +14 | 109,179 |
Total Working Age Population:
Total Households:
Total Working Age Population:
Total Households:
Total Working Age Population:
Total Households: