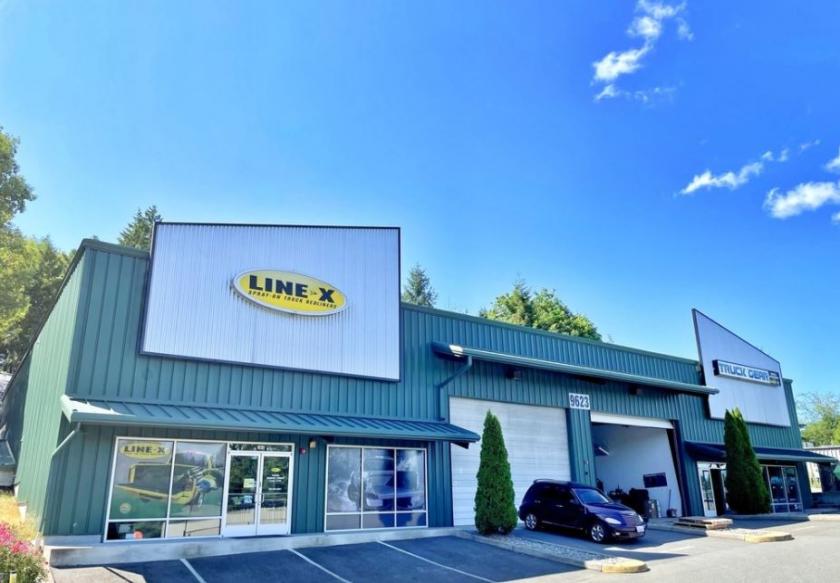
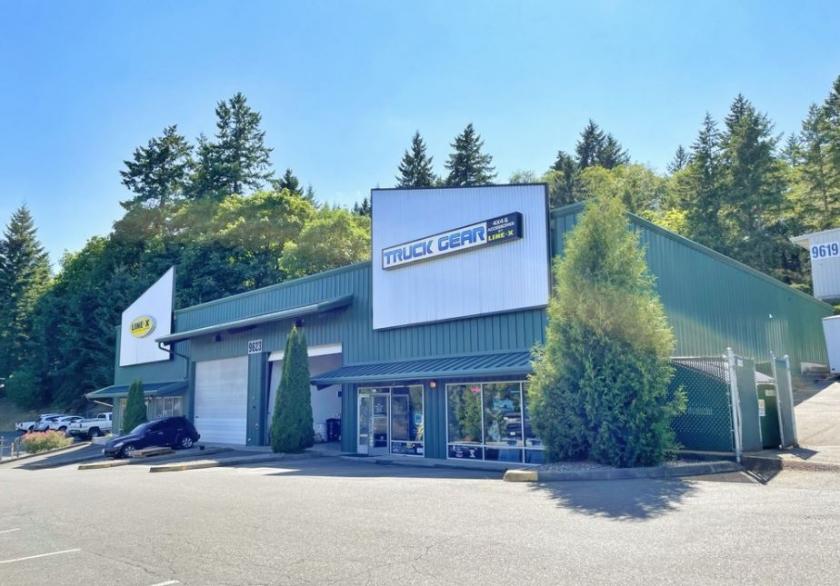
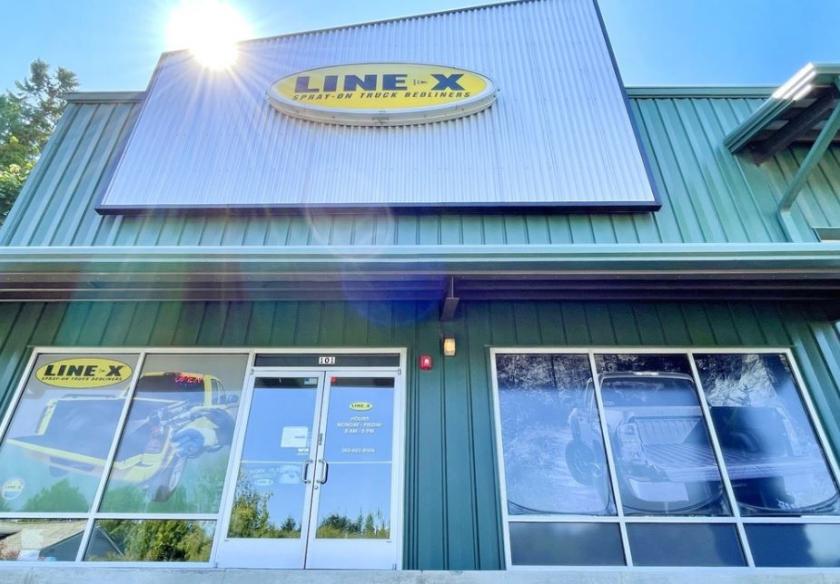
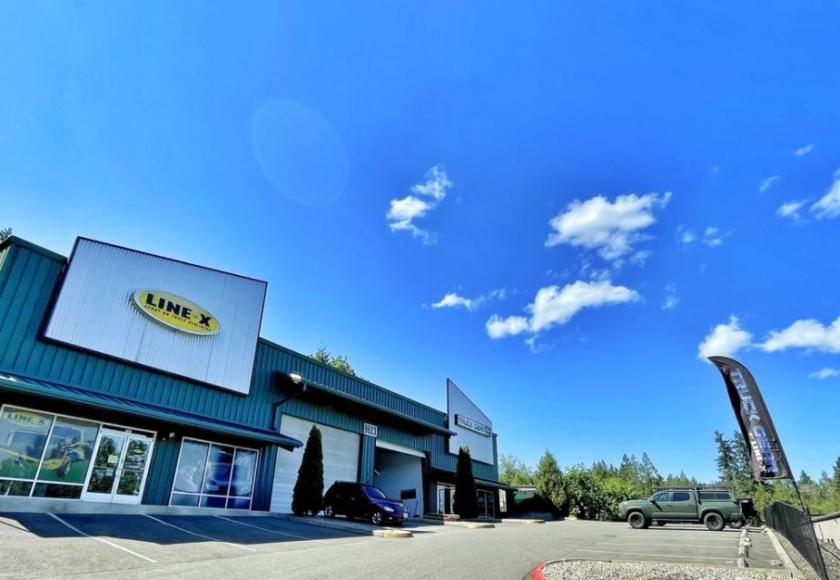
1-Mile | 3-Miles | 5-Miles | ||
---|---|---|---|---|
Total Population | 4,874 | 35,590 | 86,542 | |
Population Median Age | 40 | 38 | 38 | |
Population by Age | 0-9 Yrs | 423 (8%) | 4212 (11%) | 10733 (12%) |
10-19 Yrs | 657 (13%) | 4422 (12%) | 10072 (11%) | |
20-29 Yrs | 835 (17%) | 6591 (18%) | 15473 (17%) | |
30-39 Yrs | 593 (12%) | 4655 (13%) | 12143 (14%) | |
40-49 Yrs | 617 (12%) | 3892 (10%) | 8995 (10%) | |
50-59 Yrs | 596 (12%) | 4258 (11%) | 10618 (12%) | |
60-69 Yrs | 565 (11%) | 3742 (10%) | 9550 (11%) | |
70+ Yrs | 588 (12%) | 3818 (10%) | 8956 (10%) | |
Median HH Income | $73,453 | $81,441 | $75,011 | |
Total Household Income | < 24K | 332 (16%) | 1270 (9%) | 3402 (10%) |
25-49K | 344 (16%) | 2445 (17%) | 6147 (18%) | |
50-74K | 364 (17%) | 2583 (18%) | 6871 (20%) | |
75-99K | 190 (9%) | 1980 (14%) | 5153 (15%) | |
100-199K | 626 (30%) | 4396 (32%) | 9362 (28%) | |
200K+ | 170 (8%) | 943 (6%) | 1909 (5%) | |
Highest Education Level | No Diploma | 231 | 963 | 2411 |
Diploma or GED | 826 | 5149 | 13650 | |
Some College | 993 | 6808 | 17670 | |
Assoc. Degree | 317 | 2826 | 7096 | |
Bachelors Degree | 541 | 5248 | 12110 | |
Higher Degree | 415 | 2745 | 5054 | |
Total Housing Units | 2,182 | 14,252 | 34,877 | |
--Owner-Occupied | 973 | 8,034 | 20,785 | |
--Renter-Occupied | 1,053 | 5,584 | 12,057 | |
Owner-Occupied Values | < 100K | 13 | 366 | 1388 |
100-199K | 34 | 449 | 1905 | |
200-299K | 242 | 1965 | 6197 | |
300-399K | 397 | 2397 | 5258 | |
400-499K | 202 | 1618 | 2981 | |
500K+ | 86 | 1239 | 3055 | |
Total Working Age Population | 4,129 | 28,751 | 69,689 | |
In Work Force | 2,587 | 18,908 | 45,227 | |
Not In Work Force | 1,542 | 9,842 | 24,462 | |
Workforce Employed | 2,101 | 14,849 | 36,045 | |
Workforce Unemployed | 118 | 669 | 1,752 | |
Civlian Workforce | 2,219 | 15,518 | 37,797 | |
Military Workforce | 368 | 3,391 | 7,430 | |
Total Households | 2,026 | 13,618 | 32,843 | |
Family Households | 1,186 | 9,397 | 22,897 | |
Non-Family Households | 840 | 4,221 | 9,946 | |
Married Couple | 907 | 7,420 | 17,943 | |
Other Family | 279 | 1,977 | 4,954 | |
Married w/Child | 337 | 2,733 | 6,809 | |
Single Male w/Child | 38 | 268 | 800 | |
Single Female w/Child | 92 | 711 | 1,651 |
Population Change Last Two Decades - Plus Projection
2000 | % | 2010 | % | 2020 | % | 2030 | |
---|---|---|---|---|---|---|---|
Washington | 5,894,121 | +14 | 6,724,540 | +14 | 7,638,415 | +11 | 8,503,178 |
Jefferson County | 25,953 | +15 | 29,872 | +9 | 32,646 | +11 | 36,253 |
Kitsap County | 231,969 | +8 | 251,133 | +10 | 275,910 | +10 | 303,528 |
Total Working Age Population:
Total Households:
Total Working Age Population:
Total Households:
Total Working Age Population:
Total Households: