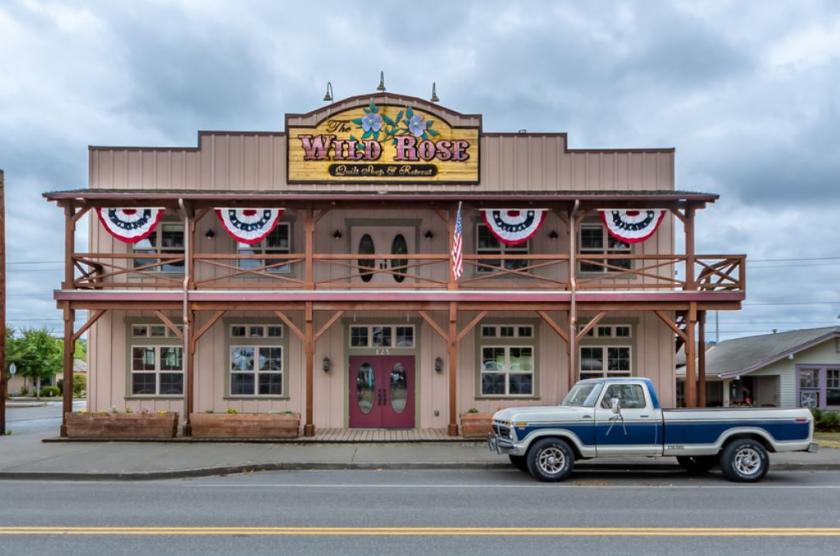
Retail Space
125 Van Scoyoc Avenue Southwest Orting, WA 98360
125 Van Scoyoc Avenue Southwest Orting, WA 98360
Details & Description
Property Highlights
- • Two story building
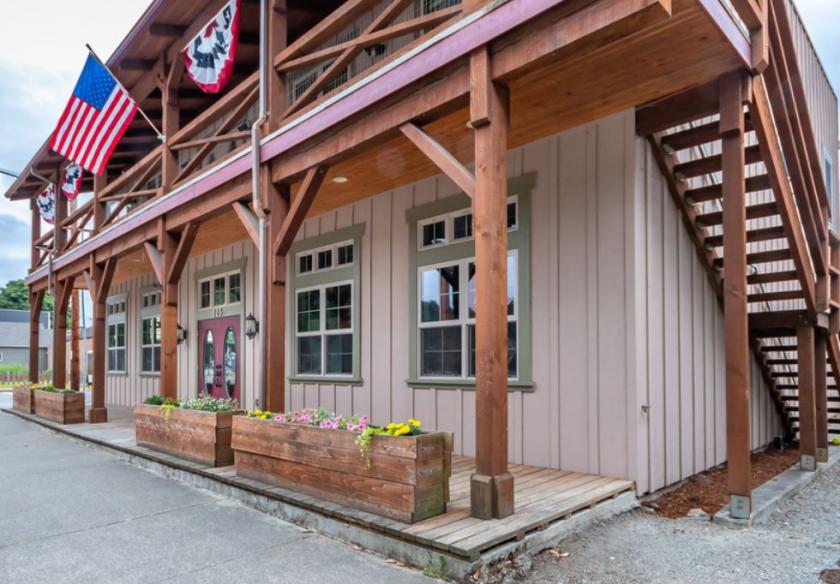
- • Private parking lot
- • Dual HVAC units on the roof
- • Security system w separate governed areas
- • Built-in vacuum system on both floors
- • Skylights on the second floor
Additional Photos


Listing Agents

Jonathan Harper
KW Commercial
O: 253-840-5574
M: 253-651-7500
jonathanharper@kw.com
KW Commercial
O: 253-840-5574
M: 253-651-7500
jonathanharper@kw.com
While we strive to provide the most accurate information, all listing information, and demographic data, is provided by third-parties. As such, MyEListing will not be responsible for the accuracy of the information. It is strongly recommended that you verify all information with the listing agent, and any relevant agencies, prior to making any decisions.


