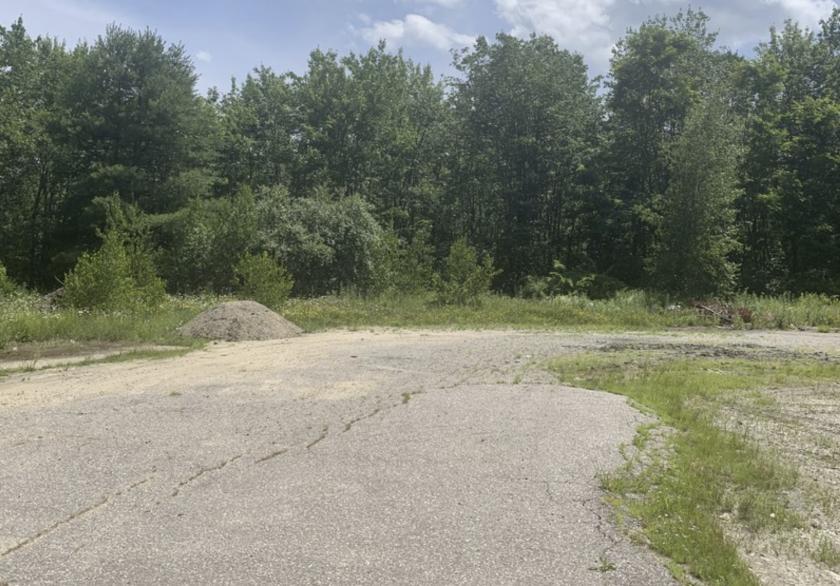
Commercial Land
68 Concord Road Lee, NH 03861
68 Concord Road Lee, NH 03861
Details & Description
Property Highlights
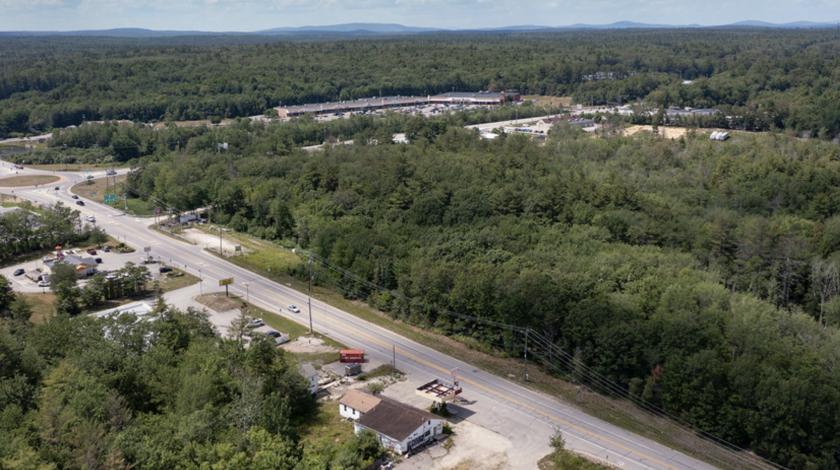
• Nearby businesses include Dunkin Donuts, Irving, Market Basket, and Wentworth-Douglass Express Care
• Heavily trafficked road traffic count approx. 33,504 for the traffic circle
Listing Agents

Ethan Ash
O: 603-610-8500
ethan.ash@kw.com
O: 603-610-8500
ethan.ash@kw.com
While we strive to provide the most accurate information, all listing information, and demographic data, is provided by third-parties. As such, MyEListing will not be responsible for the accuracy of the information. It is strongly recommended that you verify all information with the listing agent, and any relevant agencies, prior to making any decisions.