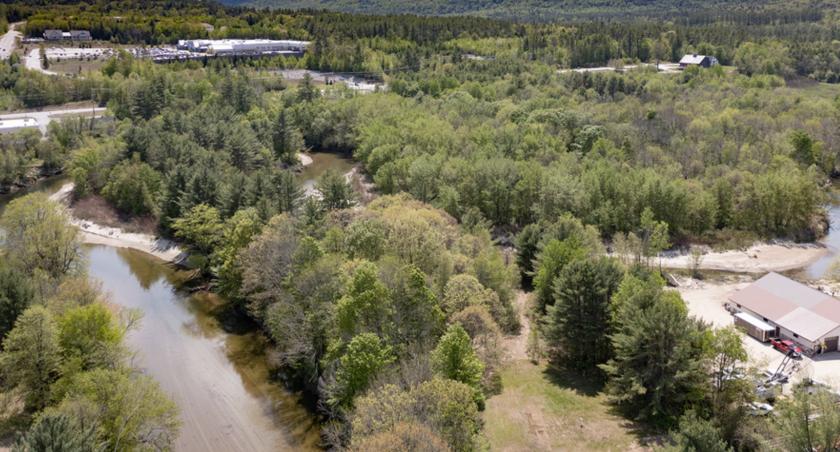
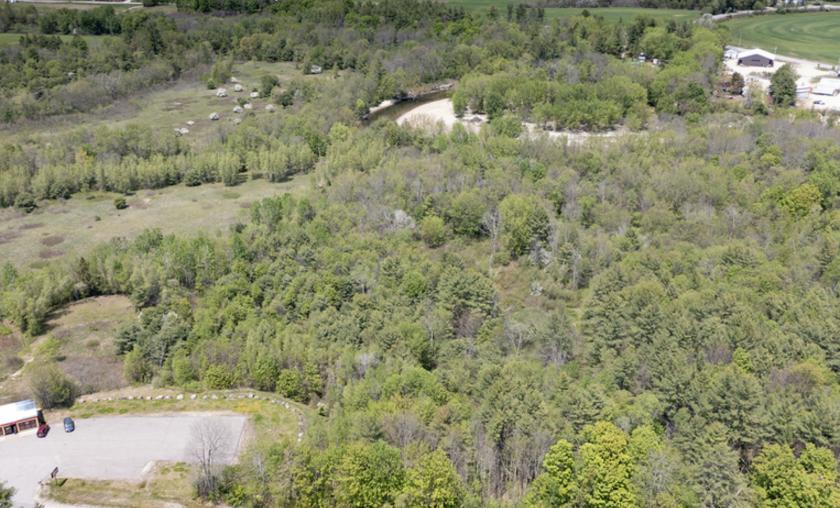
1-Mile | 3-Miles | 5-Miles | ||
---|---|---|---|---|
Total Population | 572 | 5,553 | 8,523 | |
Population Median Age | 45 | 37 | 39 | |
Population by Age | 0-9 Yrs | 63 (11%) | 391 (7%) | 688 (8%) |
10-19 Yrs | 65 (11%) | 1554 (27%) | 1967 (23%) | |
20-29 Yrs | 33 (5%) | 678 (12%) | 967 (11%) | |
30-39 Yrs | 71 (12%) | 522 (9%) | 866 (10%) | |
40-49 Yrs | 63 (11%) | 557 (10%) | 959 (11%) | |
50-59 Yrs | 64 (11%) | 683 (12%) | 1063 (12%) | |
60-69 Yrs | 112 (19%) | 557 (10%) | 1018 (11%) | |
70+ Yrs | 100 (17%) | 612 (11%) | 995 (11%) | |
Median HH Income | $29,490 | $51,617 | $53,892 | |
Total Household Income | < 24K | 117 (47%) | 483 (28%) | 774 (27%) |
25-49K | 43 (17%) | 359 (20%) | 581 (20%) | |
50-74K | 34 (13%) | 255 (14%) | 447 (15%) | |
75-99K | 14 (5%) | 220 (12%) | 385 (13%) | |
100-199K | 33 (13%) | 279 (16%) | 480 (16%) | |
200K+ | 6 (2%) | 125 (7%) | 191 (6%) | |
Highest Education Level | No Diploma | 33 | 212 | 364 |
Diploma or GED | 197 | 1019 | 1618 | |
Some College | 65 | 552 | 971 | |
Assoc. Degree | 38 | 194 | 337 | |
Bachelors Degree | 70 | 627 | 1013 | |
Higher Degree | 34 | 501 | 890 | |
Total Housing Units | 293 | 2,293 | 4,106 | |
--Owner-Occupied | 107 | 1,082 | 1,961 | |
--Renter-Occupied | 141 | 640 | 896 | |
Owner-Occupied Values | < 100K | 18 | 166 | 318 |
100-199K | 62 | 557 | 861 | |
200-299K | 16 | 170 | 394 | |
300-399K | 10 | 167 | 303 | |
400-499K | 0 | 7 | 37 | |
500K+ | 2 | 14 | 49 | |
Total Working Age Population | 481 | 4,928 | 7,409 | |
In Work Force | 284 | 2,719 | 4,192 | |
Not In Work Force | 197 | 2,210 | 3,217 | |
Workforce Employed | 255 | 2,513 | 3,940 | |
Workforce Unemployed | 29 | 206 | 252 | |
Civlian Workforce | 284 | 2,719 | 4,192 | |
Military Workforce | 0 | 0 | 0 | |
Total Households | 248 | 1,721 | 2,858 | |
Family Households | 173 | 1,126 | 1,777 | |
Non-Family Households | 75 | 596 | 1,080 | |
Married Couple | 83 | 667 | 1,157 | |
Other Family | 90 | 458 | 621 | |
Married w/Child | 24 | 247 | 437 | |
Single Male w/Child | 31 | 116 | 157 | |
Single Female w/Child | 13 | 164 | 208 |
Population Change Last Two Decades - Plus Projection
2000 | % | 2010 | % | 2020 | % | 2030 | |
---|---|---|---|---|---|---|---|
New Hampshire | 1,235,786 | +7 | 1,316,470 | +3 | 1,349,908 | +4 | 1,402,878 |
Belknap County | 56,325 | +7 | 60,088 | +2 | 61,340 | +3 | 63,333 |
Grafton County | 81,743 | +9 | 89,118 | +2 | 91,099 | +4 | 94,829 |
Total Working Age Population:
Total Households:
Total Working Age Population:
Total Households:
Total Working Age Population:
Total Households: