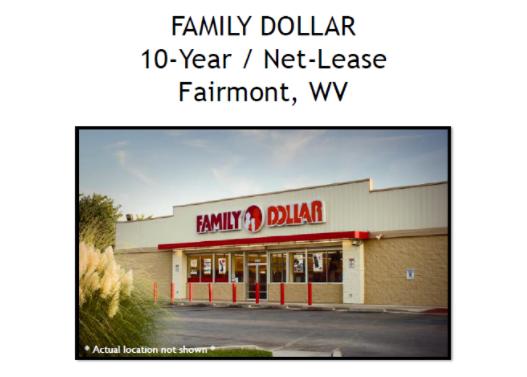
1-Mile | 3-Miles | 5-Miles | ||
---|---|---|---|---|
Total Population | 2,288 | 18,199 | 37,784 | |
Population Median Age | 43 | 41 | 40 | |
Population by Age | 0-9 Yrs | 251 (10%) | 2314 (12%) | 4669 (12%) |
10-19 Yrs | 228 (9%) | 1685 (9%) | 4009 (10%) | |
20-29 Yrs | 309 (13%) | 3024 (16%) | 6040 (15%) | |
30-39 Yrs | 245 (10%) | 1940 (10%) | 4243 (11%) | |
40-49 Yrs | 256 (11%) | 2086 (11%) | 4576 (12%) | |
50-59 Yrs | 262 (11%) | 2325 (12%) | 4400 (11%) | |
60-69 Yrs | 328 (14%) | 2371 (13%) | 5136 (13%) | |
70+ Yrs | 408 (17%) | 2455 (13%) | 4712 (12%) | |
Median HH Income | $55,712 | $55,073 | $50,603 | |
Total Household Income | < 24K | 130 (12%) | 1662 (21%) | 3939 (25%) |
25-49K | 295 (29%) | 1843 (23%) | 3774 (24%) | |
50-74K | 240 (23%) | 1320 (17%) | 2837 (18%) | |
75-99K | 124 (12%) | 1089 (14%) | 1996 (12%) | |
100-199K | 164 (16%) | 1493 (19%) | 2594 (16%) | |
200K+ | 53 (5%) | 292 (3%) | 449 (2%) | |
Highest Education Level | No Diploma | 143 | 1158 | 2290 |
Diploma or GED | 562 | 4184 | 9480 | |
Some College | 282 | 2092 | 4703 | |
Assoc. Degree | 146 | 1064 | 2080 | |
Bachelors Degree | 316 | 2574 | 4548 | |
Higher Degree | 205 | 1391 | 2449 | |
Total Housing Units | 1,156 | 8,652 | 17,918 | |
--Owner-Occupied | 721 | 5,339 | 10,915 | |
--Renter-Occupied | 285 | 2,360 | 4,674 | |
Owner-Occupied Values | < 100K | 181 | 1541 | 4121 |
100-199K | 316 | 2256 | 4216 | |
200-299K | 186 | 1173 | 1792 | |
300-399K | 20 | 264 | 512 | |
400-499K | 7 | 44 | 121 | |
500K+ | 11 | 60 | 153 | |
Total Working Age Population | 1,905 | 14,927 | 31,075 | |
In Work Force | 1,181 | 9,098 | 17,991 | |
Not In Work Force | 724 | 5,830 | 13,083 | |
Workforce Employed | 1,145 | 8,730 | 17,061 | |
Workforce Unemployed | 31 | 353 | 909 | |
Civlian Workforce | 1,177 | 9,082 | 17,970 | |
Military Workforce | 4 | 15 | 21 | |
Total Households | 1,006 | 7,699 | 15,589 | |
Family Households | 645 | 4,772 | 9,779 | |
Non-Family Households | 360 | 2,926 | 5,810 | |
Married Couple | 482 | 3,449 | 7,164 | |
Other Family | 164 | 1,324 | 2,615 | |
Married w/Child | 142 | 1,176 | 2,529 | |
Single Male w/Child | 35 | 175 | 436 | |
Single Female w/Child | 62 | 523 | 1,005 |
Population Change Last Two Decades - Plus Projection
2000 | % | 2010 | % | 2020 | % | 2030 | |
---|---|---|---|---|---|---|---|
West Virginia | 1,808,344 | +2 | 1,852,994 | -1 | 1,828,079 | -1 | 1,806,816 |
Harrison County | 68,652 | +1 | 69,099 | -1 | 68,148 | -2 | 66,590 |
Marion County | 56,598 | 0 | 56,418 | +1 | 56,713 | -2 | 55,548 |
Monongalia County | 81,866 | +17 | 96,189 | +14 | 109,410 | +9 | 119,394 |
Taylor County | 16,089 | +5 | 16,895 | 0 | 16,846 | -4 | 16,252 |
Total Working Age Population:
Total Households:
Total Working Age Population:
Total Households:
Total Working Age Population:
Total Households: