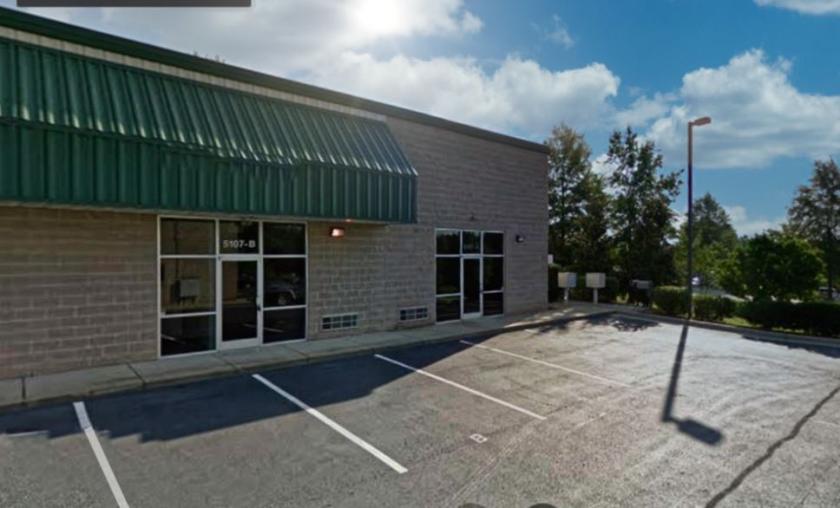
Flex-Office-Warehouse
5107 Unicon Drive Wake Forest, NC 27587
5107 Unicon Drive Wake Forest, NC 27587
Details & Description
Property Highlights
- • 1,000-2,000 SF Flex Space
- • Unit A Clear space and Restroom
- • Unit B 3 Offices, Lobby, Ample Storage, Restroom
- • Units Offered Together or Separately
- • Off US-1 , 3 Miles to I-540
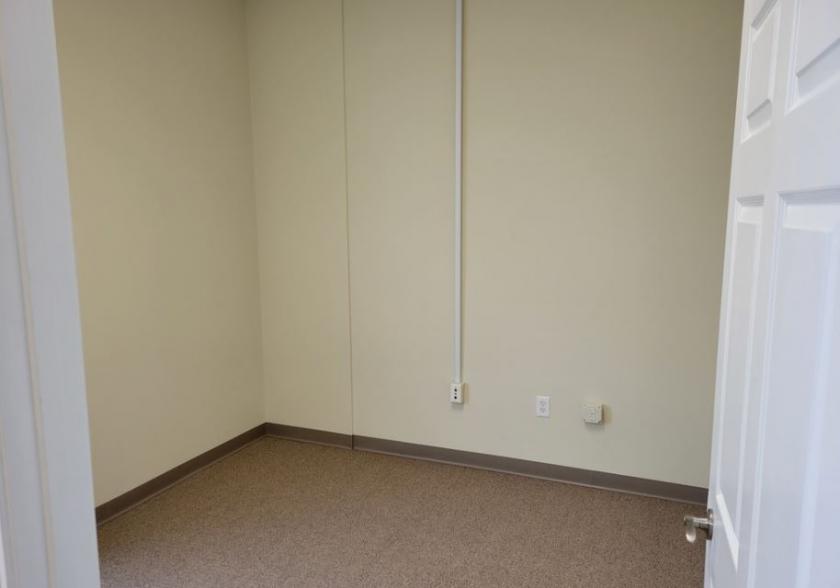
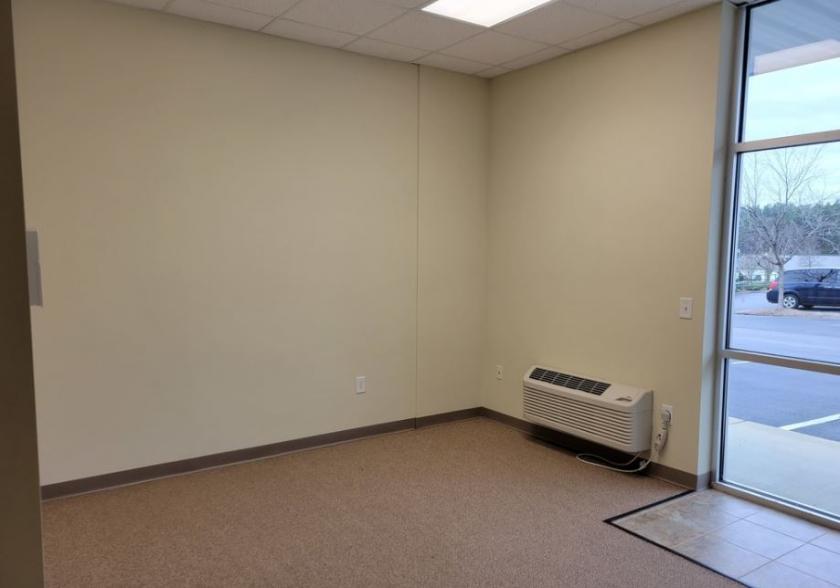
Additional Photos

Listing Agents

Vandan Gandhi
KW Commercial
O: 919-475-5769
van.kwcommercial@gmail.com
KW Commercial
O: 919-475-5769
van.kwcommercial@gmail.com
While we strive to provide the most accurate information, all listing information, and demographic data, is provided by third-parties. As such, MyEListing will not be responsible for the accuracy of the information. It is strongly recommended that you verify all information with the listing agent, and any relevant agencies, prior to making any decisions.


