Specialty Real Estate
541 Ulster Heights Road Ellenville, NY 12428
541 Ulster Heights Road Ellenville, NY 12428

Details & Description
Property Highlights
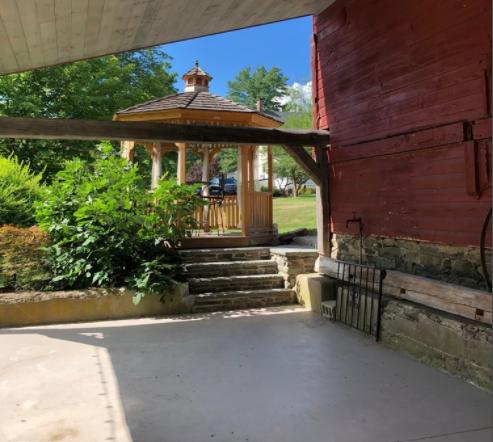
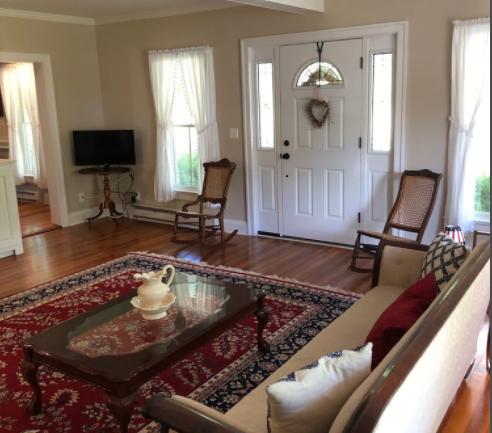
• 6.02 manicured acres, cement board siding, 3 electric meters, spray foam insulation.
• Check out The Wagar Farm at Hanging Rock on Airbnb httpswww.airbnb.comrooms14625726
Listing Agents

Jay Feinberg
KW Commercial
O: 845-610-6485
M: 845-863-6116
jay.feinberg@kwcommercial.com
KW Commercial
O: 845-610-6485
M: 845-863-6116
jay.feinberg@kwcommercial.com

James Walker
KW Commercial
O: 845-610-6065
M: 845-849-5102
james.walker@kw.com
KW Commercial
O: 845-610-6065
M: 845-849-5102
james.walker@kw.com
While we strive to provide the most accurate information, all listing information, and demographic data, is provided by third-parties. As such, MyEListing will not be responsible for the accuracy of the information. It is strongly recommended that you verify all information with the listing agent, and any relevant agencies, prior to making any decisions.