Specialty Real Estate
6565 Oakley Drive Northeast Fridley, MN 55432
6565 Oakley Drive Northeast Fridley, MN 55432

Details & Description
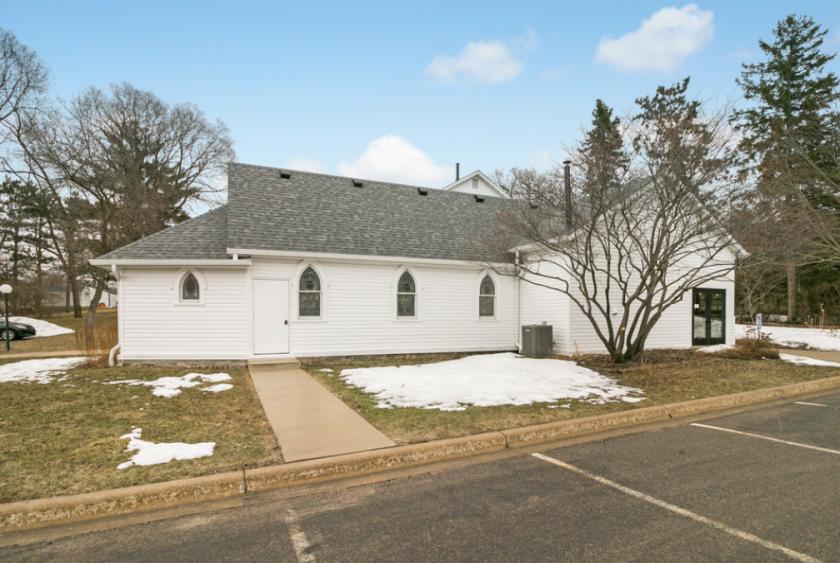
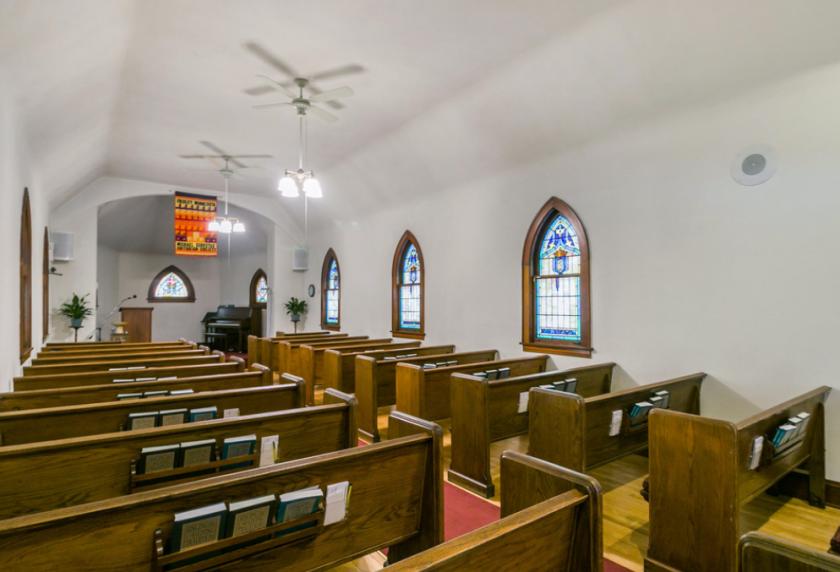
Property Highlights
- • Quaint, neighborhood church with lots of charm
- • Worship area seats approximately 100
- • Obeo tour obeo.com1161436
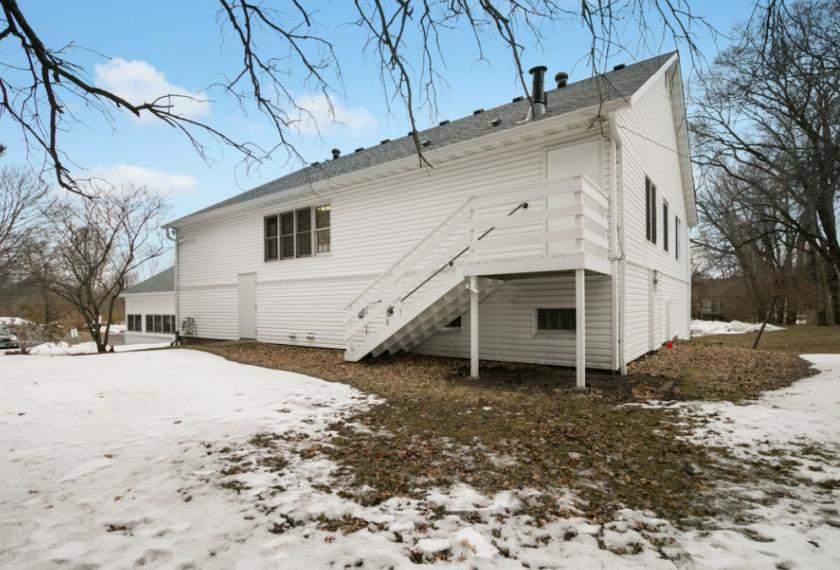
Additional Photos

Listing Agents

David Finigan
KW Commercial
O: 651-262-1008
M: 651-274-5034
dave.finigan@kwcommercial.com
KW Commercial
O: 651-262-1008
M: 651-274-5034
dave.finigan@kwcommercial.com
While we strive to provide the most accurate information, all listing information, and demographic data, is provided by third-parties. As such, MyEListing will not be responsible for the accuracy of the information. It is strongly recommended that you verify all information with the listing agent, and any relevant agencies, prior to making any decisions.


