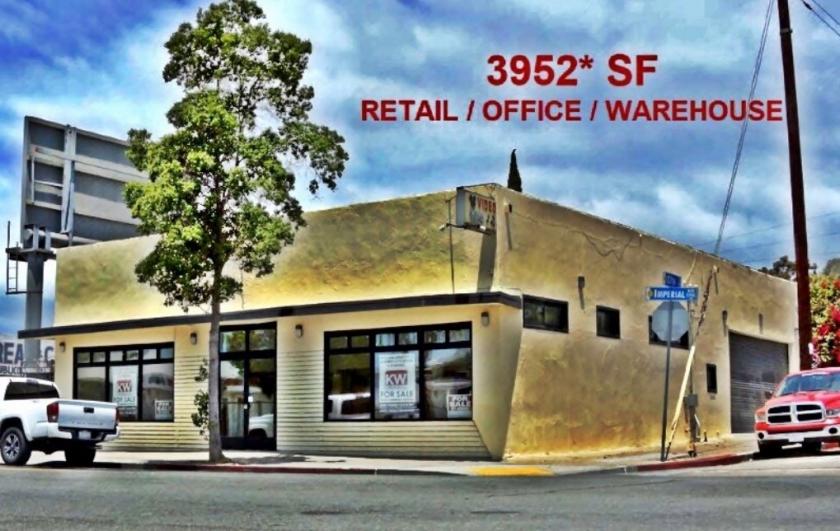
Retail Space
2692 Imperial Avenue San Diego, CA 92102
2692 Imperial Avenue San Diego, CA 92102
Details & Description
Property Highlights
- • Seller Will Carry
- • Zoning Potentially Allows Specific Marijuana Uses
- • Mixed Use Density Bonus
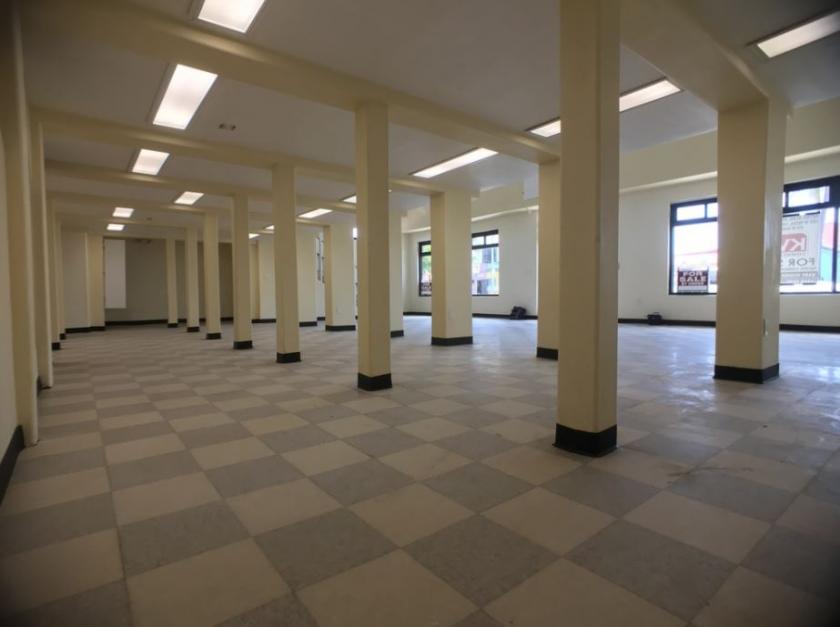
- • Tenant Improvements Just Completed
- • Great Window Line for Merchandising
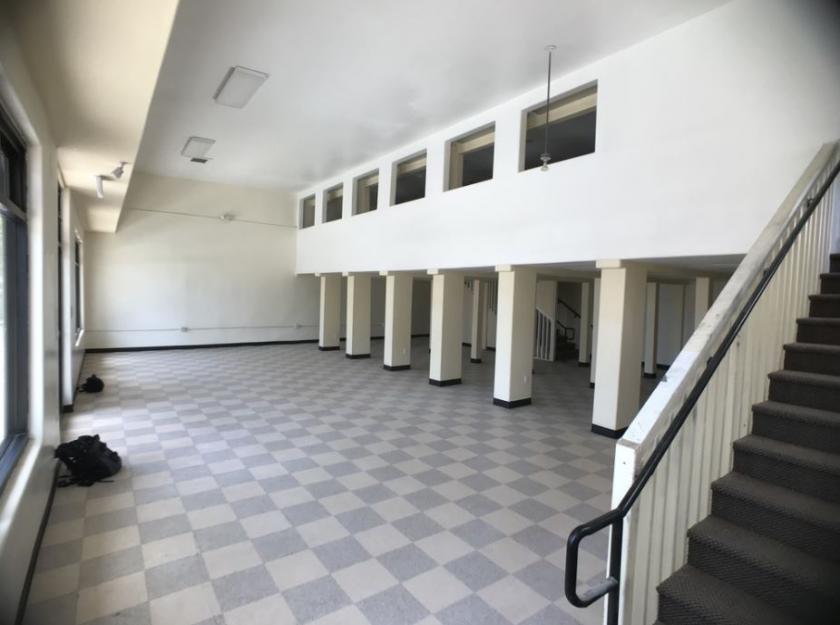
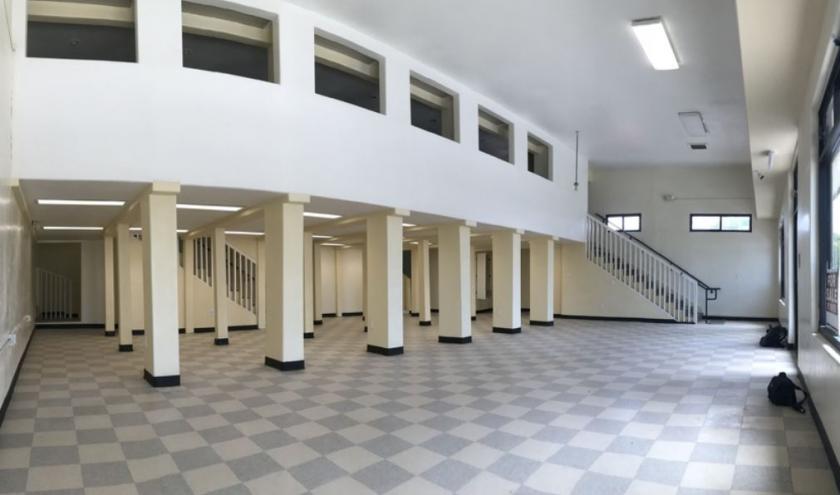
- • Office Mezzanine
Additional Photos
Listing Agents

Mark Hughes
KW Commercial
O: 858-720-1900
M: 714-614-7357
mhughes@kwcommercial.com
KW Commercial
O: 858-720-1900
M: 714-614-7357
mhughes@kwcommercial.com
While we strive to provide the most accurate information, all listing information, and demographic data, is provided by third-parties. As such, MyEListing will not be responsible for the accuracy of the information. It is strongly recommended that you verify all information with the listing agent, and any relevant agencies, prior to making any decisions.


