Industrial Properties
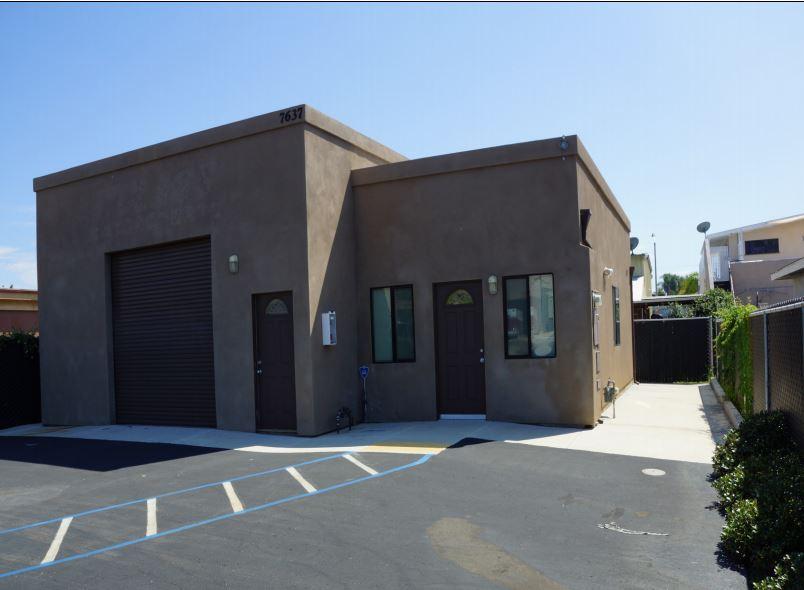
7637 Lemon Avenue Lemon Grove, CA 91945
7637 Lemon Avenue Lemon Grove, CA 91945
Details & Description
Property Highlights
- • Great Central Business district location
- • Immediate proximity to Home Depot Shopping Center
- • Close proximity to San Diego Trolly System
- • Newly renovated
- • Excellent security... fully fenced and gated
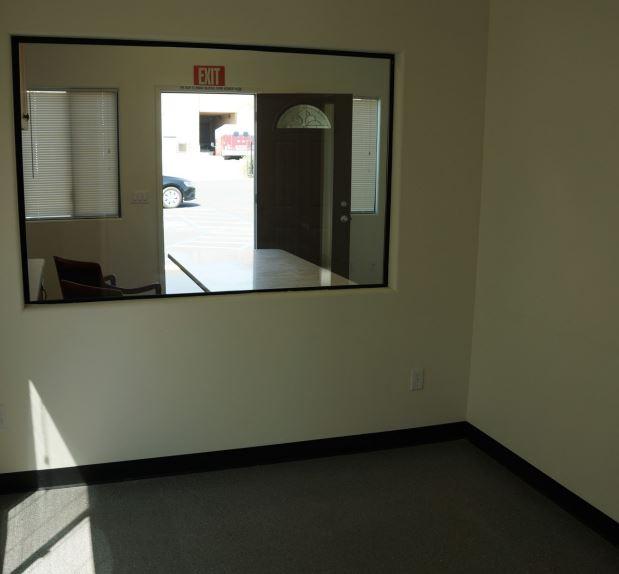
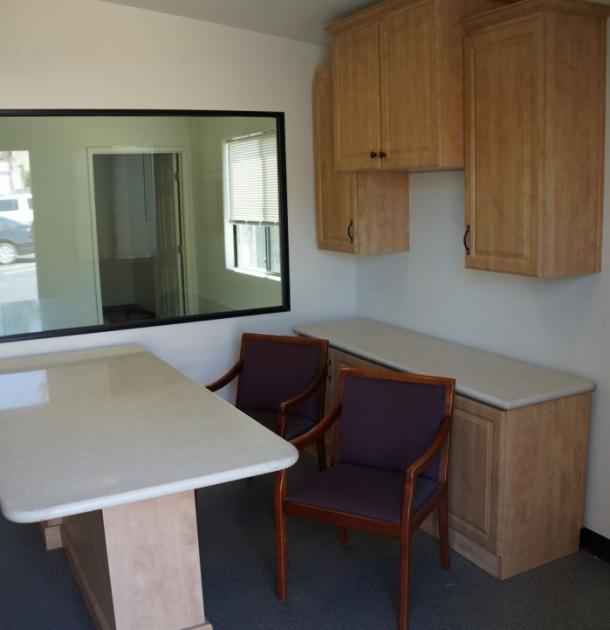
Additional Photos

Listing Agents

Mark Hughes
KW Commercial
O: 858-720-1900
M: 714-614-7357
mhughes@kwcommercial.com
KW Commercial
O: 858-720-1900
M: 714-614-7357
mhughes@kwcommercial.com
While we strive to provide the most accurate information, all listing information, and demographic data, is provided by third-parties. As such, MyEListing will not be responsible for the accuracy of the information. It is strongly recommended that you verify all information with the listing agent, and any relevant agencies, prior to making any decisions.


