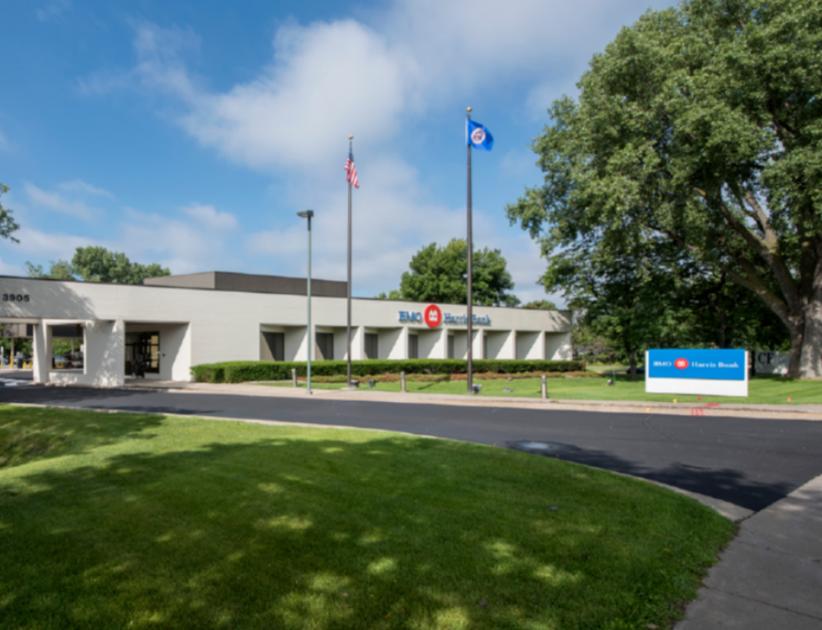
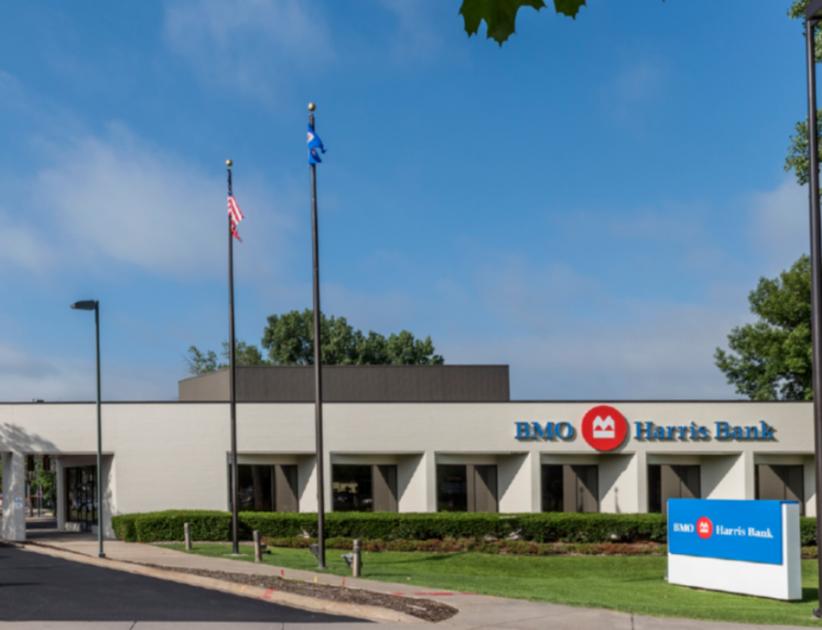
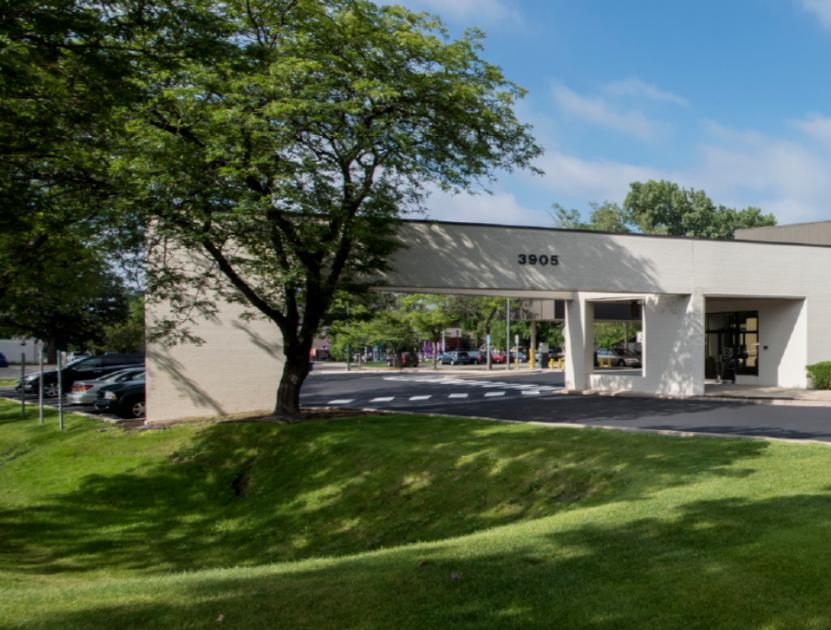
KW Commercial is pleased to exclusively market for sale a single tenant NNN leased BMO Harris Bank property located within the Minneapolis MSA in Edina, Minnesota. There are 7 years remaining on the lease which has eight 5-year renewal options. Additionally, there is a 1.5% rent escalation each year. BMO Harris Bank has a one-time right to terminate the lease, to be effective upon the first day of the eighty-fifth (85th) full calendar month following the Commencement Date (December 15, 2015) provided BMO Harris Bank gives written notice no sooner than eighteen (18) months and not later than twelve (12) months prior to the Early Termination Date.The 8,132 square foot BMO Harris Bank property is located just off of France Avenue (30,000 vpd) which is a primary north-south thoroughfare through the Edina retail area. The Bank is situated in a thriving retail corridor with the Edina Galleria, Southdale Center, Target, Crate & Barrel, a new Restoration Hardware, Apple, Tiffany & Company and Whole Foods. There are over 104,000 people living within three miles of the property with an average household income of of $100,475.BMO Harris Bank is the 8th largest bank in North America by assets and has more than 12 million customers globally. Founded in 1882, there are over 570 branches in Illinois, Indiana, Arizona, Missouri, Minnesota, Kansas, Florida and Wisconsin. BMO Harris Bank has over $774 billion in total assets and has built a solid foundation for growth. There are three operating groups within the BMO Harris Bank system: Personal and Commercial Banking, BMO Wealth Managment, and BMO Capital Markets. For fiscal year 2018, adjusted net income was up 9%, total net revenue rose by 5%, and adjusted earnings per share grew by 10%. The Edina Southdale branch, with $96 million in deposits, is a full service branch offering banking and investment services to both personal and commercial customers.