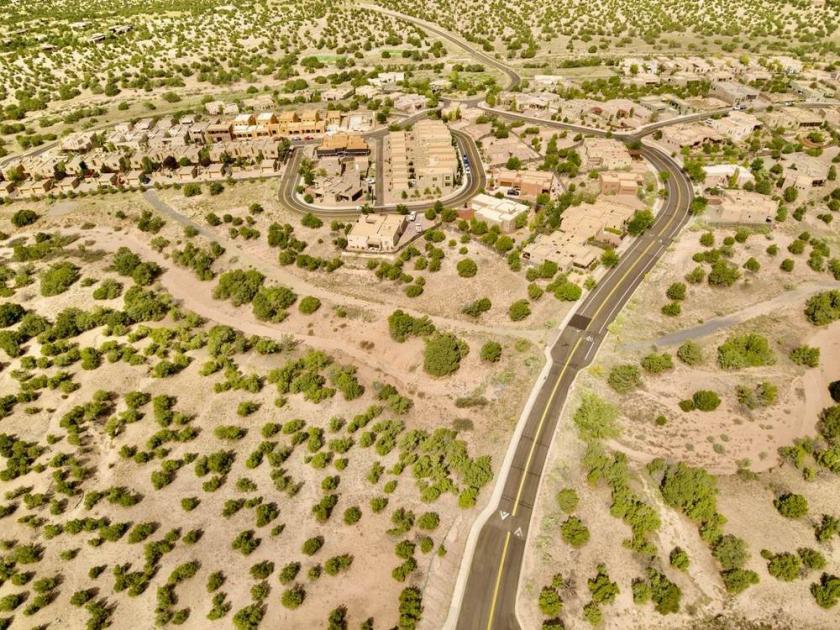
1-Mile | 3-Miles | 5-Miles | ||
---|---|---|---|---|
Total Population | 639 | 17,854 | 75,402 | |
Population Median Age | 53 | 44 | 43 | |
Population by Age | 0-9 Yrs | 30 (4%) | 1619 (9%) | 7552 (10%) |
10-19 Yrs | 56 (8%) | 1856 (10%) | 8189 (10%) | |
20-29 Yrs | 29 (4%) | 1642 (9%) | 8906 (11%) | |
30-39 Yrs | 49 (7%) | 2502 (14%) | 9475 (12%) | |
40-49 Yrs | 44 (6%) | 2283 (12%) | 9418 (12%) | |
50-59 Yrs | 119 (18%) | 2508 (14%) | 9924 (13%) | |
60-69 Yrs | 165 (25%) | 2759 (15%) | 11136 (14%) | |
70+ Yrs | 146 (22%) | 2686 (15%) | 10802 (14%) | |
Median HH Income | $85,263 | $55,050 | $56,342 | |
Total Household Income | < 24K | 25 (9%) | 1394 (18%) | 6111 (19%) |
25-49K | 63 (22%) | 2054 (27%) | 8153 (25%) | |
50-74K | 40 (14%) | 1497 (19%) | 6077 (19%) | |
75-99K | 21 (7%) | 830 (11%) | 3947 (12%) | |
100-199K | 86 (31%) | 1350 (17%) | 5949 (18%) | |
200K+ | 38 (13%) | 416 (5%) | 1660 (5%) | |
Highest Education Level | No Diploma | 32 | 1622 | 7087 |
Diploma or GED | 79 | 3603 | 12765 | |
Some College | 83 | 2533 | 10335 | |
Assoc. Degree | 31 | 618 | 3125 | |
Bachelors Degree | 140 | 2645 | 11256 | |
Higher Degree | 173 | 2551 | 10906 | |
Total Housing Units | 316 | 8,235 | 36,979 | |
--Owner-Occupied | 231 | 5,154 | 19,454 | |
--Renter-Occupied | 43 | 2,388 | 12,442 | |
Owner-Occupied Values | < 100K | 16 | 698 | 2443 |
100-199K | 13 | 700 | 3383 | |
200-299K | 10 | 1467 | 5328 | |
300-399K | 28 | 992 | 3282 | |
400-499K | 34 | 470 | 1677 | |
500K+ | 130 | 828 | 3341 | |
Total Working Age Population | 579 | 15,326 | 63,220 | |
In Work Force | 300 | 9,180 | 38,870 | |
Not In Work Force | 279 | 6,146 | 24,350 | |
Workforce Employed | 294 | 8,752 | 37,224 | |
Workforce Unemployed | 6 | 423 | 1,616 | |
Civlian Workforce | 300 | 9,174 | 38,840 | |
Military Workforce | 0 | 6 | 30 | |
Total Households | 274 | 7,542 | 31,896 | |
Family Households | 196 | 4,234 | 17,394 | |
Non-Family Households | 78 | 3,308 | 14,503 | |
Married Couple | 168 | 2,833 | 11,614 | |
Other Family | 28 | 1,401 | 5,780 | |
Married w/Child | 23 | 764 | 3,621 | |
Single Male w/Child | 1 | 181 | 769 | |
Single Female w/Child | 13 | 524 | 2,255 |
Population Change Last Two Decades - Plus Projection
2000 | % | 2010 | % | 2020 | % | 2030 | |
---|---|---|---|---|---|---|---|
New Mexico | 1,819,046 | +13 | 2,059,179 | +6 | 2,187,183 | +6 | 2,308,475 |
Santa Fe County | 129,292 | +12 | 144,170 | +5 | 151,767 | +7 | 162,782 |
Total Working Age Population:
Total Households:
Total Working Age Population:
Total Households:
Total Working Age Population:
Total Households: