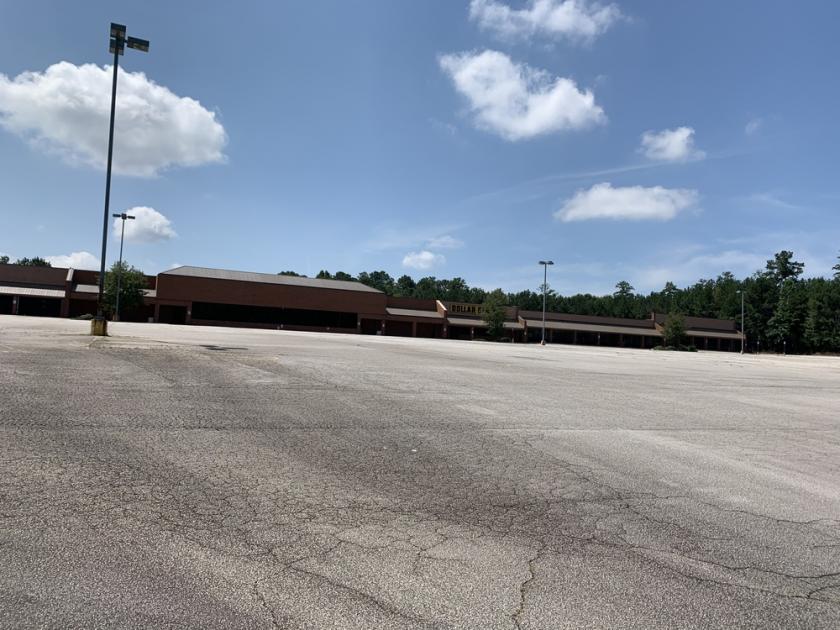
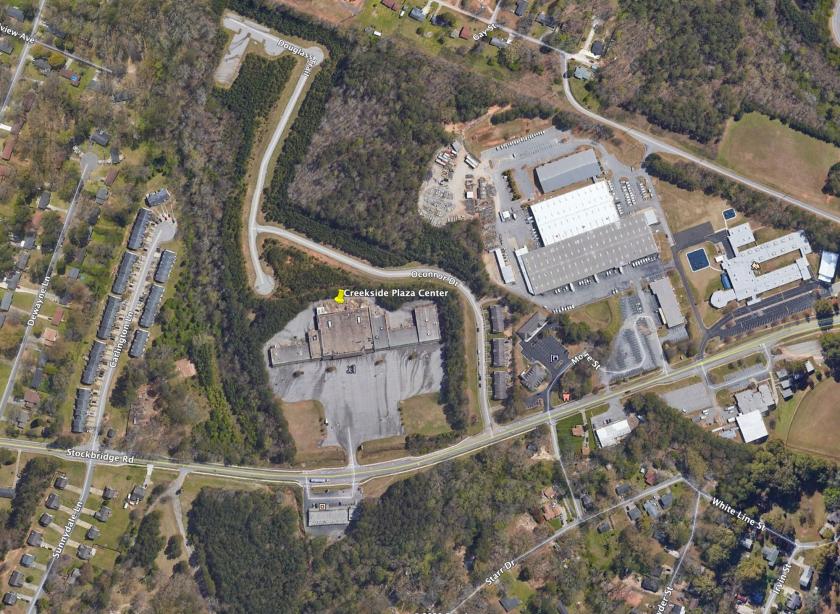
1-Mile | 3-Miles | 5-Miles | ||
---|---|---|---|---|
Total Population | 5,743 | 57,221 | 180,517 | |
Population Median Age | 37 | 35 | 34 | |
Population by Age | 0-9 Yrs | 746 (12%) | 8513 (14%) | 27157 (15%) |
10-19 Yrs | 987 (17%) | 8709 (15%) | 29108 (16%) | |
20-29 Yrs | 816 (14%) | 8970 (15%) | 27941 (15%) | |
30-39 Yrs | 514 (8%) | 7927 (13%) | 24340 (13%) | |
40-49 Yrs | 745 (12%) | 7215 (12%) | 24245 (13%) | |
50-59 Yrs | 793 (13%) | 6904 (12%) | 21712 (12%) | |
60-69 Yrs | 708 (12%) | 5773 (10%) | 16461 (9%) | |
70+ Yrs | 434 (7%) | 3211 (5%) | 9553 (5%) | |
Median HH Income | $49,480 | $54,255 | $51,133 | |
Total Household Income | < 24K | 479 (27%) | 3996 (22%) | 12949 (22%) |
25-49K | 415 (23%) | 4341 (23%) | 15627 (26%) | |
50-74K | 283 (16%) | 3895 (21%) | 12837 (21%) | |
75-99K | 183 (10%) | 2212 (12%) | 7869 (13%) | |
100-199K | 377 (21%) | 3183 (17%) | 8098 (13%) | |
200K+ | 22 (1%) | 496 (2%) | 1061 (1%) | |
Highest Education Level | No Diploma | 857 | 5367 | 15777 |
Diploma or GED | 997 | 12284 | 36726 | |
Some College | 807 | 8037 | 25940 | |
Assoc. Degree | 256 | 2688 | 9140 | |
Bachelors Degree | 389 | 4630 | 15316 | |
Higher Degree | 231 | 2859 | 8192 | |
Total Housing Units | 1,988 | 20,479 | 65,297 | |
--Owner-Occupied | 1,059 | 9,534 | 29,585 | |
--Renter-Occupied | 701 | 8,588 | 28,856 | |
Owner-Occupied Values | < 100K | 426 | 3714 | 12725 |
100-199K | 504 | 4051 | 12528 | |
200-299K | 102 | 1028 | 2671 | |
300-399K | 19 | 287 | 648 | |
400-499K | 0 | 114 | 296 | |
500K+ | 8 | 341 | 718 | |
Total Working Age Population | 4,501 | 43,337 | 135,286 | |
In Work Force | 2,588 | 27,272 | 88,896 | |
Not In Work Force | 1,913 | 16,065 | 46,390 | |
Workforce Employed | 2,321 | 25,068 | 82,002 | |
Workforce Unemployed | 266 | 2,134 | 6,795 | |
Civlian Workforce | 2,588 | 27,202 | 88,797 | |
Military Workforce | 0 | 69 | 99 | |
Total Households | 1,760 | 18,122 | 58,441 | |
Family Households | 1,264 | 12,859 | 40,954 | |
Non-Family Households | 496 | 5,263 | 17,488 | |
Married Couple | 643 | 7,160 | 21,615 | |
Other Family | 621 | 5,699 | 19,339 | |
Married w/Child | 293 | 3,114 | 9,459 | |
Single Male w/Child | 33 | 486 | 1,804 | |
Single Female w/Child | 161 | 2,110 | 8,045 |
Population Change Last Two Decades - Plus Projection
2000 | % | 2010 | % | 2020 | % | 2030 | |
---|---|---|---|---|---|---|---|
Georgia | 8,186,453 | +18 | 9,687,653 | +12 | 10,833,472 | +13 | 12,292,423 |
Clayton County | 236,517 | +10 | 259,424 | +18 | 304,838 | +22 | 373,234 |
Fayette County | 91,263 | +17 | 106,567 | +10 | 117,544 | +17 | 137,595 |
Fulton County | 816,006 | +13 | 920,581 | +19 | 1,099,181 | +18 | 1,300,861 |
Henry County | 119,341 | +71 | 203,922 | +18 | 239,866 | +20 | 286,950 |
Total Working Age Population:
Total Households:
Total Working Age Population:
Total Households:
Total Working Age Population:
Total Households: