Industrial Properties
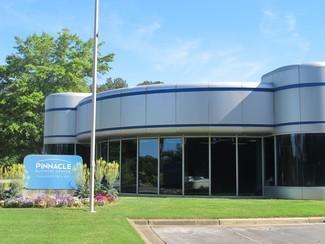
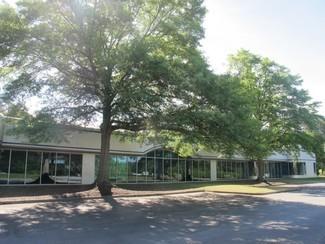
300 Pinnacle Way Norcross, GA 30071
300 Pinnacle Way Norcross, GA 30071
Details & Description
Property Highlights
• Easy Access off Interstate 85 Indian Trail Rd
• Established Market
Listing Agents

Cravens Doggett
O: 678-578-2700
M: 678-852-3833
cravens@kw.com
O: 678-578-2700
M: 678-852-3833
cravens@kw.com
While we strive to provide the most accurate information, all listing information, and demographic data, is provided by third-parties. As such, MyEListing will not be responsible for the accuracy of the information. It is strongly recommended that you verify all information with the listing agent, and any relevant agencies, prior to making any decisions.