Multifamily Housing
910 Cumberland Avenue Dayton, OH 45406
910 Cumberland Avenue Dayton, OH 45406
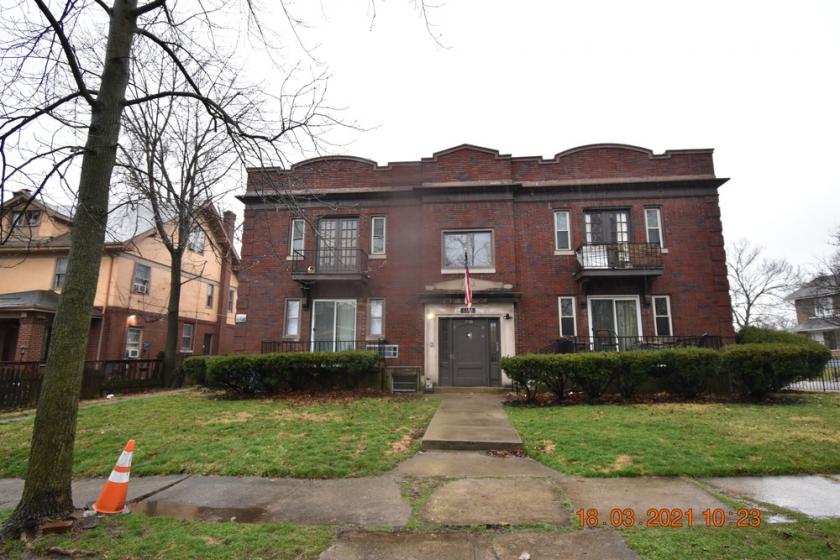
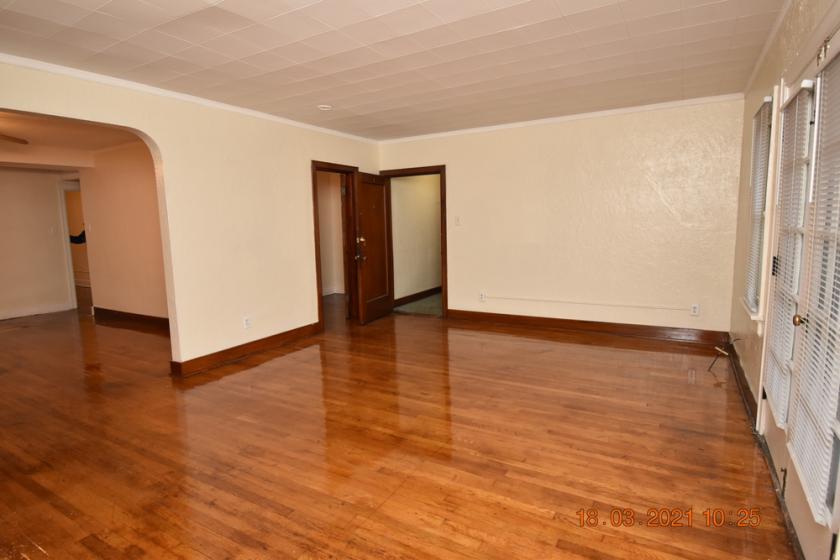
Details & Description
Property Highlights
- • New Electric Panels Meters
- • Large Units - 1000 - 1500 SF - Unique Floorplans
- • 100 Leased
- • Some New Furnaces New Tankless Water Heaters
Listing Agents

Jennifer Donathan
O: 513-520-3540
jennifer.donathan@kwcommercial.com
O: 513-520-3540
jennifer.donathan@kwcommercial.com
While we strive to provide the most accurate information, all listing information, and demographic data, is provided by third-parties. As such, MyEListing will not be responsible for the accuracy of the information. It is strongly recommended that you verify all information with the listing agent, and any relevant agencies, prior to making any decisions.