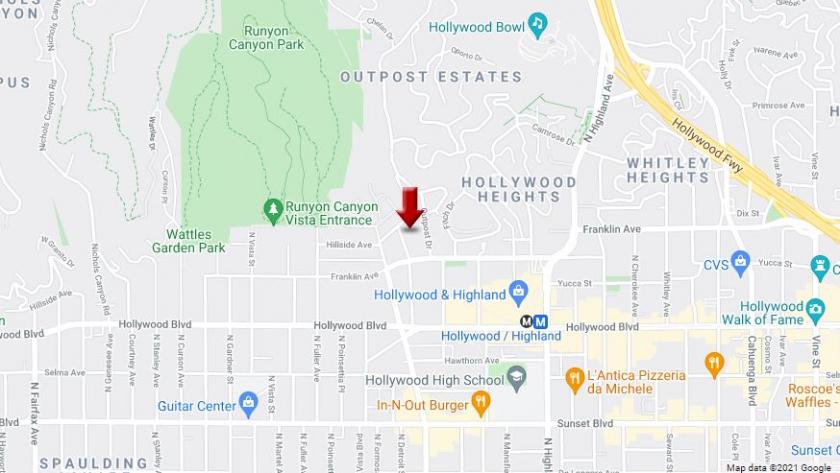
1-Mile | 3-Miles | 5-Miles | ||
---|---|---|---|---|
Total Population | 38,652 | 271,583 | 828,106 | |
Population Median Age | 41 | 40 | 39 | |
Population by Age | 0-9 Yrs | 1200 (3%) | 19404 (7%) | 75670 (9%) |
10-19 Yrs | 1418 (3%) | 15724 (5%) | 64768 (7%) | |
20-29 Yrs | 9405 (24%) | 53967 (19%) | 148764 (17%) | |
30-39 Yrs | 9661 (24%) | 57823 (21%) | 162779 (19%) | |
40-49 Yrs | 6093 (15%) | 41284 (15%) | 122756 (14%) | |
50-59 Yrs | 4432 (11%) | 33562 (12%) | 102336 (12%) | |
60-69 Yrs | 2939 (7%) | 25675 (9%) | 78040 (9%) | |
70+ Yrs | 3505 (9%) | 24146 (8%) | 72994 (8%) | |
Median HH Income | $57,901 | $67,555 | $64,075 | |
Total Household Income | < 24K | 5993 (25%) | 29407 (21%) | 77135 (21%) |
25-49K | 4376 (18%) | 23599 (17%) | 71894 (19%) | |
50-74K | 3668 (15%) | 20721 (15%) | 58513 (15%) | |
75-99K | 2650 (11%) | 15390 (11%) | 41368 (11%) | |
100-199K | 4385 (18%) | 28338 (20%) | 74250 (20%) | |
200K+ | 2039 (8%) | 17868 (13%) | 42768 (11%) | |
Highest Education Level | No Diploma | 1634 | 21345 | 91802 |
Diploma or GED | 3691 | 29105 | 98650 | |
Some College | 5680 | 36158 | 104767 | |
Assoc. Degree | 2375 | 12447 | 38639 | |
Bachelors Degree | 13664 | 81717 | 205156 | |
Higher Degree | 5815 | 38094 | 96112 | |
Total Housing Units | 26,412 | 154,397 | 409,899 | |
--Owner-Occupied | 3,340 | 30,152 | 86,884 | |
--Renter-Occupied | 19,771 | 105,171 | 279,043 | |
Owner-Occupied Values | < 100K | 37 | 425 | 1311 |
100-199K | 33 | 302 | 778 | |
200-299K | 48 | 301 | 1267 | |
300-399K | 249 | 967 | 2774 | |
400-499K | 294 | 1441 | 4590 | |
500K+ | 2679 | 26714 | 76164 | |
Total Working Age Population | 36,816 | 242,569 | 712,933 | |
In Work Force | 28,368 | 180,989 | 513,165 | |
Not In Work Force | 8,448 | 61,580 | 199,768 | |
Workforce Employed | 25,923 | 168,736 | 482,427 | |
Workforce Unemployed | 2,419 | 12,107 | 30,456 | |
Civlian Workforce | 28,342 | 180,842 | 512,884 | |
Military Workforce | 26 | 146 | 281 | |
Total Households | 23,112 | 135,322 | 365,927 | |
Family Households | 5,431 | 48,483 | 165,456 | |
Non-Family Households | 17,680 | 86,839 | 200,471 | |
Married Couple | 3,996 | 35,333 | 113,093 | |
Other Family | 1,435 | 13,150 | 52,363 | |
Married w/Child | 882 | 11,797 | 43,004 | |
Single Male w/Child | 99 | 1,361 | 5,941 | |
Single Female w/Child | 245 | 3,385 | 14,198 |
Population Change Last Two Decades - Plus Projection
2000 | % | 2010 | % | 2020 | % | 2030 | |
---|---|---|---|---|---|---|---|
California | 33,871,648 | +10 | 37,253,956 | +9 | 40,467,295 | +8 | 43,631,295 |
Los Angeles County | 9,519,338 | +3 | 9,818,605 | +6 | 10,369,367 | +4 | 10,759,850 |
Total Working Age Population:
Total Households:
Total Working Age Population:
Total Households:
Total Working Age Population:
Total Households: