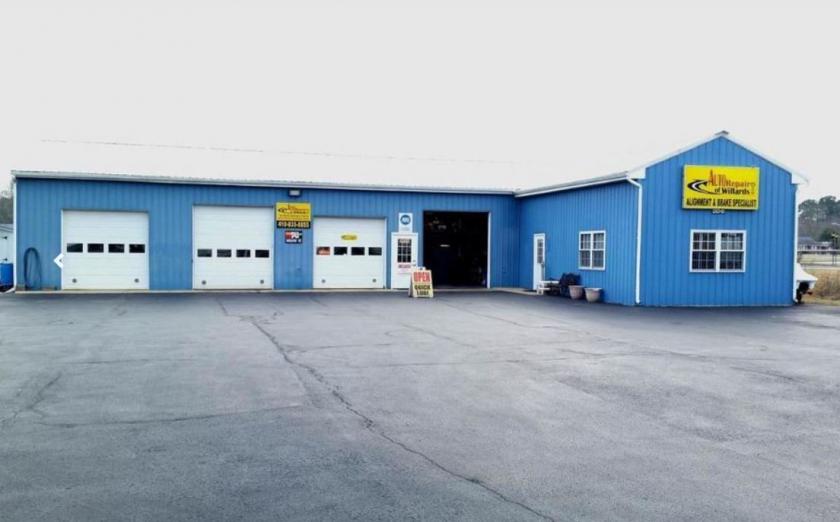
Retail Space
36349 Old Ocean City Road Willards, MD 21874
36349 Old Ocean City Road Willards, MD 21874
Details & Description
Property Highlights
- • Great Location Willards, Maryland
- • Energy Efficient Lighting
- • Yard Area Fenced
- • Public Water and Sewer
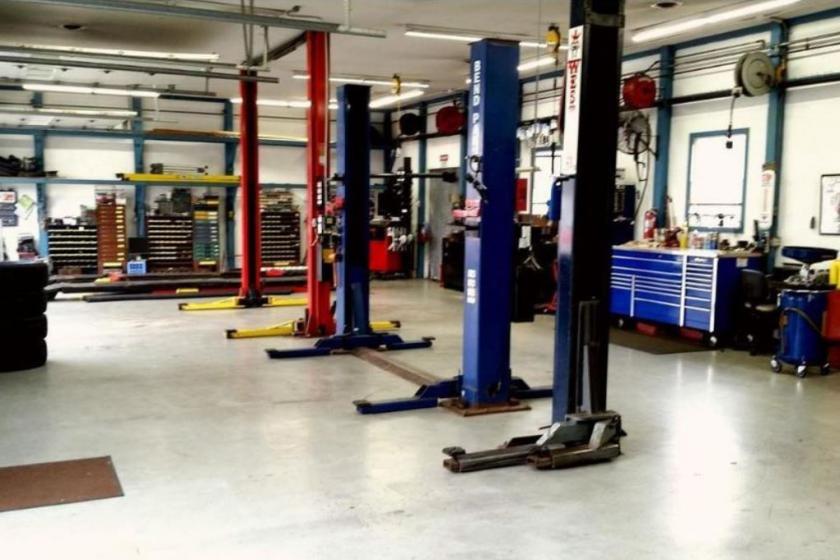
Additional Photos


Listing Agents

Chuck Campbell
O: 410-995-8450
M: 443-880-0130
chuck.campbell@kw.com
O: 410-995-8450
M: 443-880-0130
chuck.campbell@kw.com
While we strive to provide the most accurate information, all listing information, and demographic data, is provided by third-parties. As such, MyEListing will not be responsible for the accuracy of the information. It is strongly recommended that you verify all information with the listing agent, and any relevant agencies, prior to making any decisions.


