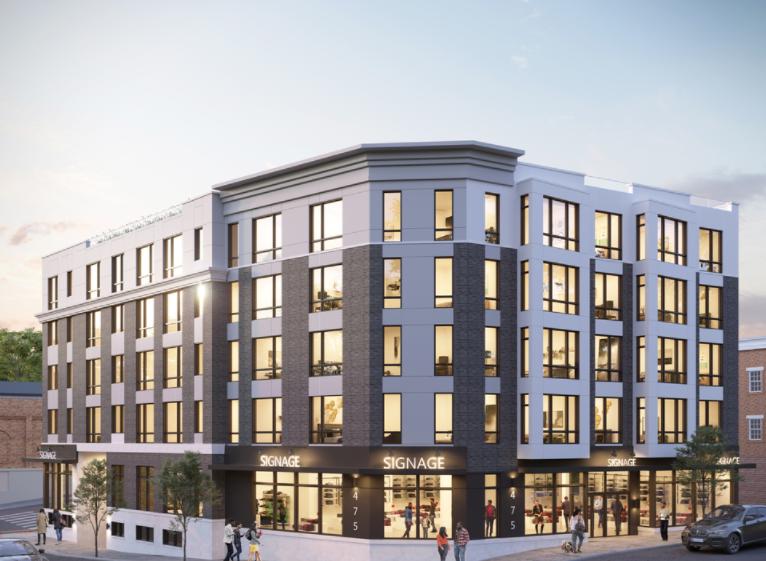
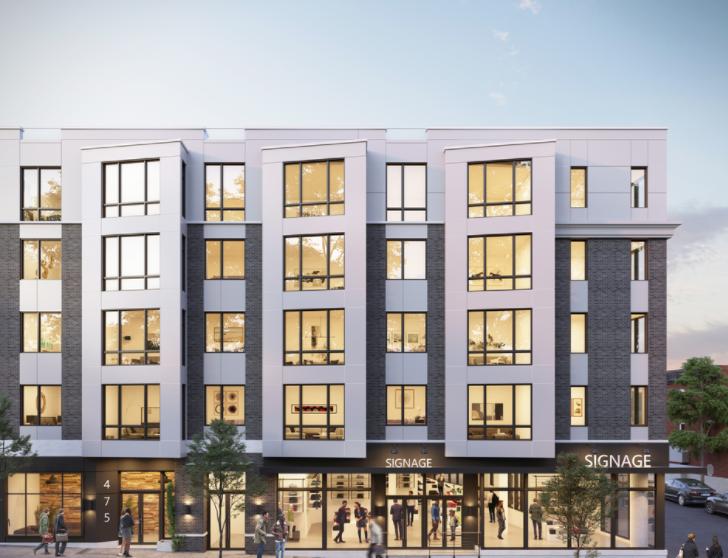
1-Mile | 3-Miles | 5-Miles | ||
---|---|---|---|---|
Total Population | 69,649 | 392,023 | 1,211,422 | |
Population Median Age | 35 | 36 | 38 | |
Population by Age | 0-9 Yrs | 10378 (14%) | 50839 (12%) | 126957 (10%) |
10-19 Yrs | 7725 (11%) | 30511 (7%) | 97799 (8%) | |
20-29 Yrs | 11022 (15%) | 70905 (18%) | 222093 (18%) | |
30-39 Yrs | 12526 (17%) | 92935 (23%) | 261306 (21%) | |
40-49 Yrs | 9668 (13%) | 53750 (13%) | 162759 (13%) | |
50-59 Yrs | 7679 (11%) | 39572 (10%) | 130323 (10%) | |
60-69 Yrs | 6195 (8%) | 30297 (7%) | 108814 (8%) | |
70+ Yrs | 4456 (6%) | 23213 (5%) | 101371 (8%) | |
Median HH Income | $50,470 | $97,838 | $94,023 | |
Total Household Income | < 24K | 7771 (29%) | 27240 (16%) | 102450 (18%) |
25-49K | 5468 (20%) | 20801 (12%) | 70622 (13%) | |
50-74K | 3788 (14%) | 19162 (11%) | 58800 (10%) | |
75-99K | 2763 (10%) | 15414 (9%) | 49953 (9%) | |
100-199K | 5142 (19%) | 44029 (27%) | 132813 (24%) | |
200K+ | 1706 (6%) | 35925 (22%) | 125135 (23%) | |
Highest Education Level | No Diploma | 7220 | 26757 | 109010 |
Diploma or GED | 13116 | 50463 | 144570 | |
Some College | 6576 | 30520 | 85532 | |
Assoc. Degree | 2551 | 9849 | 30491 | |
Bachelors Degree | 11402 | 93395 | 300844 | |
Higher Degree | 6403 | 76800 | 236974 | |
Total Housing Units | 29,858 | 180,740 | 604,262 | |
--Owner-Occupied | 6,850 | 46,032 | 147,053 | |
--Renter-Occupied | 19,788 | 116,539 | 392,720 | |
Owner-Occupied Values | < 100K | 497 | 1422 | 6407 |
100-199K | 674 | 2594 | 6461 | |
200-299K | 1824 | 7454 | 14338 | |
300-399K | 1567 | 8709 | 17373 | |
400-499K | 772 | 5373 | 12678 | |
500K+ | 1516 | 20481 | 89796 | |
Total Working Age Population | 54,591 | 322,300 | 1,030,025 | |
In Work Force | 36,412 | 230,599 | 717,185 | |
Not In Work Force | 18,178 | 91,702 | 312,840 | |
Workforce Employed | 33,490 | 219,844 | 682,959 | |
Workforce Unemployed | 2,899 | 10,642 | 33,841 | |
Civlian Workforce | 36,389 | 230,486 | 716,799 | |
Military Workforce | 24 | 113 | 386 | |
Total Households | 26,638 | 162,571 | 539,773 | |
Family Households | 16,984 | 92,446 | 259,427 | |
Non-Family Households | 9,654 | 70,125 | 280,347 | |
Married Couple | 9,288 | 66,318 | 184,709 | |
Other Family | 7,696 | 26,128 | 74,717 | |
Married w/Child | 4,252 | 30,647 | 76,186 | |
Single Male w/Child | 595 | 2,397 | 6,621 | |
Single Female w/Child | 3,155 | 9,466 | 26,316 |
Population Change Last Two Decades - Plus Projection
2000 | % | 2010 | % | 2020 | % | 2030 | |
---|---|---|---|---|---|---|---|
New Jersey | 8,414,350 | +4 | 8,791,894 | +4 | 9,132,700 | +4 | 9,530,900 |
Bergen County | 884,118 | +2 | 905,116 | +7 | 967,500 | +7 | 1,031,500 |
Essex County | 793,633 | -1 | 783,969 | +3 | 808,300 | +3 | 829,800 |
Hudson County | 608,975 | +4 | 634,266 | +12 | 708,100 | +6 | 747,400 |
Union County | 522,541 | +3 | 536,499 | +7 | 573,000 | +6 | 605,600 |
New York | 18,976,457 | +2 | 19,378,102 | +4 | 20,146,131 | +2 | 20,604,030 |
Kings County | 2,465,326 | +2 | 2,504,700 | +9 | 2,738,283 | +5 | 2,863,996 |
New York County | 1,537,195 | +3 | 1,585,873 | +6 | 1,688,894 | +2 | 1,727,631 |
Queens County | 2,229,379 | 0 | 2,230,722 | +9 | 2,436,549 | +5 | 2,565,268 |
Richmond County | 443,728 | +6 | 468,730 | +3 | 481,351 | +1 | 488,119 |
Total Working Age Population:
Total Households:
Total Working Age Population:
Total Households:
Total Working Age Population:
Total Households: