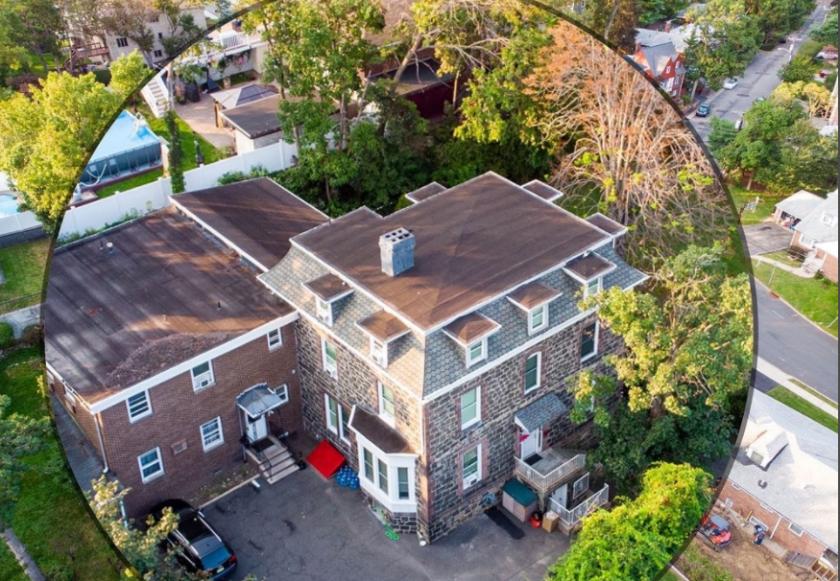
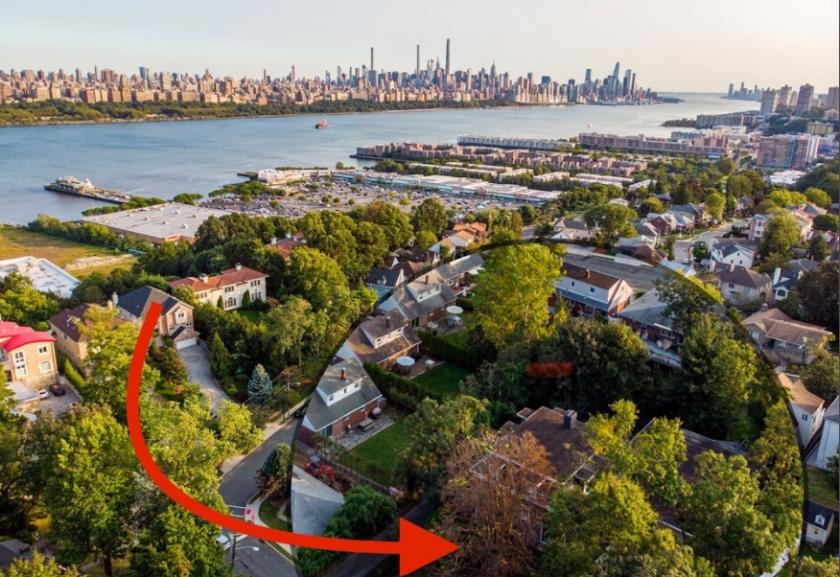
1-Mile | 3-Miles | 5-Miles | ||
---|---|---|---|---|
Total Population | 56,509 | 862,992 | 2,189,370 | |
Population Median Age | 41 | 40 | 39 | |
Population by Age | 0-9 Yrs | 6455 (11%) | 89768 (10%) | 244007 (11%) |
10-19 Yrs | 3573 (6%) | 77506 (8%) | 213921 (9%) | |
20-29 Yrs | 8231 (14%) | 144330 (16%) | 362673 (16%) | |
30-39 Yrs | 11310 (20%) | 145811 (16%) | 383260 (17%) | |
40-49 Yrs | 6588 (11%) | 111314 (12%) | 279783 (12%) | |
50-59 Yrs | 7233 (12%) | 108621 (12%) | 270251 (12%) | |
60-69 Yrs | 6371 (11%) | 90089 (10%) | 213864 (9%) | |
70+ Yrs | 6748 (11%) | 95552 (11%) | 221612 (10%) | |
Median HH Income | $86,417 | $71,444 | $68,460 | |
Total Household Income | < 24K | 4292 (17%) | 83967 (23%) | 223132 (24%) |
25-49K | 3283 (13%) | 56482 (15%) | 147400 (16%) | |
50-74K | 3099 (12%) | 46568 (12%) | 117008 (12%) | |
75-99K | 2888 (12%) | 37002 (10%) | 92053 (10%) | |
100-199K | 6878 (28%) | 78871 (21%) | 190510 (20%) | |
200K+ | 3546 (14%) | 58595 (16%) | 147289 (16%) | |
Highest Education Level | No Diploma | 5050 | 97505 | 266645 |
Diploma or GED | 10315 | 116261 | 294319 | |
Some College | 4707 | 75611 | 192080 | |
Assoc. Degree | 1683 | 28245 | 77079 | |
Bachelors Degree | 13319 | 166680 | 409980 | |
Higher Degree | 7989 | 154121 | 348587 | |
Total Housing Units | 25,881 | 403,733 | 1,034,222 | |
--Owner-Occupied | 9,293 | 99,755 | 223,047 | |
--Renter-Occupied | 14,694 | 261,730 | 694,345 | |
Owner-Occupied Values | < 100K | 62 | 3632 | 9620 |
100-199K | 378 | 5093 | 10228 | |
200-299K | 1129 | 7958 | 16581 | |
300-399K | 1727 | 10514 | 24566 | |
400-499K | 1633 | 9485 | 22650 | |
500K+ | 4364 | 63073 | 139402 | |
Total Working Age Population | 48,291 | 727,744 | 1,817,756 | |
In Work Force | 32,508 | 474,005 | 1,197,846 | |
Not In Work Force | 15,783 | 253,739 | 619,910 | |
Workforce Employed | 31,303 | 445,379 | 1,122,177 | |
Workforce Unemployed | 1,205 | 28,497 | 75,000 | |
Civlian Workforce | 32,508 | 473,876 | 1,197,177 | |
Military Workforce | 0 | 130 | 669 | |
Total Households | 23,986 | 361,484 | 917,392 | |
Family Households | 15,268 | 190,515 | 481,454 | |
Non-Family Households | 8,719 | 170,969 | 435,938 | |
Married Couple | 11,577 | 119,909 | 290,096 | |
Other Family | 3,691 | 70,606 | 191,357 | |
Married w/Child | 4,741 | 48,583 | 118,261 | |
Single Male w/Child | 298 | 5,016 | 14,838 | |
Single Female w/Child | 746 | 22,387 | 68,382 |
Population Change Last Two Decades - Plus Projection
2000 | % | 2010 | % | 2020 | % | 2030 | |
---|---|---|---|---|---|---|---|
New Jersey | 8,414,350 | +4 | 8,791,894 | +4 | 9,132,700 | +4 | 9,530,900 |
Bergen County | 884,118 | +2 | 905,116 | +7 | 967,500 | +7 | 1,031,500 |
Hudson County | 608,975 | +4 | 634,266 | +12 | 708,100 | +6 | 747,400 |
New York | 18,976,457 | +2 | 19,378,102 | +4 | 20,146,131 | +2 | 20,604,030 |
Bronx County | 1,332,650 | +4 | 1,385,108 | +10 | 1,519,809 | +6 | 1,604,168 |
New York County | 1,537,195 | +3 | 1,585,873 | +6 | 1,688,894 | +2 | 1,727,631 |
Queens County | 2,229,379 | 0 | 2,230,722 | +9 | 2,436,549 | +5 | 2,565,268 |
Westchester County | 923,459 | +3 | 949,113 | +5 | 996,039 | +4 | 1,037,234 |
Total Working Age Population:
Total Households:
Total Working Age Population:
Total Households:
Total Working Age Population:
Total Households: