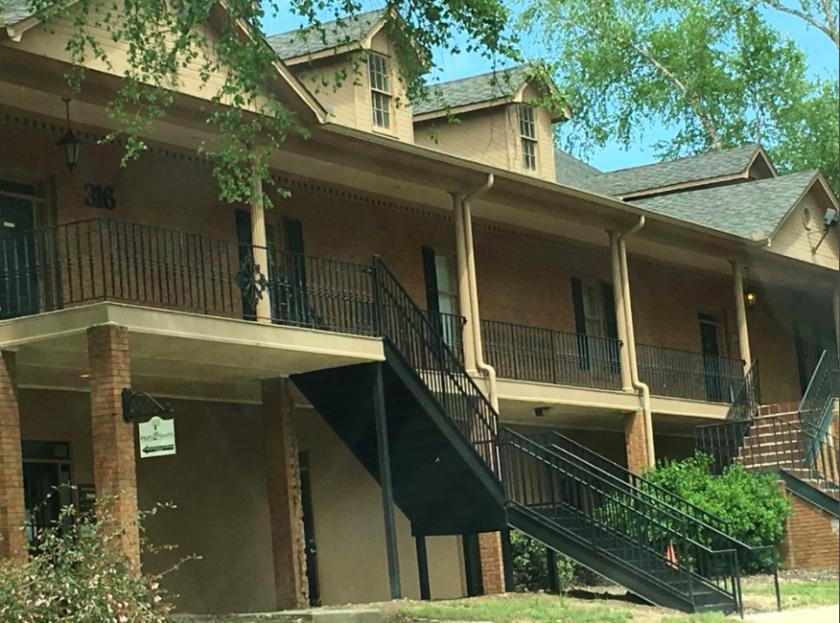
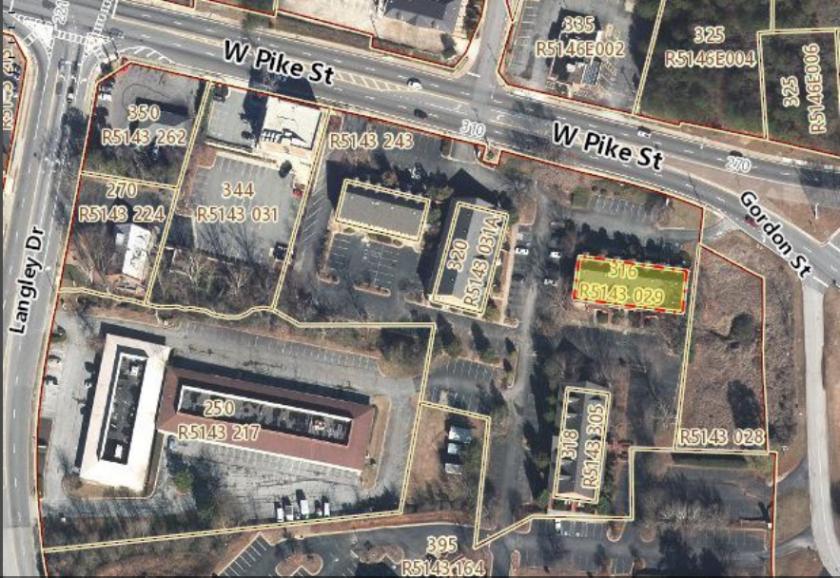
1-Mile | 3-Miles | 5-Miles | ||
---|---|---|---|---|
Total Population | 7,328 | 79,138 | 203,407 | |
Population Median Age | 34 | 35 | 35 | |
Population by Age | 0-9 Yrs | 1319 (17%) | 11629 (14%) | 27628 (13%) |
10-19 Yrs | 882 (12%) | 11195 (14%) | 31914 (15%) | |
20-29 Yrs | 1123 (15%) | 12337 (15%) | 27853 (13%) | |
30-39 Yrs | 1268 (17%) | 11458 (14%) | 27495 (13%) | |
40-49 Yrs | 802 (10%) | 11121 (14%) | 30431 (14%) | |
50-59 Yrs | 835 (11%) | 9967 (12%) | 27990 (13%) | |
60-69 Yrs | 596 (8%) | 6857 (8%) | 18598 (9%) | |
70+ Yrs | 504 (6%) | 4575 (5%) | 11498 (5%) | |
Median HH Income | $45,314 | $62,271 | $73,623 | |
Total Household Income | < 24K | 698 (26%) | 4447 (17%) | 8205 (13%) |
25-49K | 701 (26%) | 5834 (23%) | 12336 (19%) | |
50-74K | 517 (19%) | 4655 (18%) | 11652 (18%) | |
75-99K | 301 (11%) | 4278 (16%) | 10778 (17%) | |
100-199K | 347 (13%) | 5109 (20%) | 15894 (25%) | |
200K+ | 89 (3%) | 1005 (3%) | 4237 (6%) | |
Highest Education Level | No Diploma | 815 | 6895 | 14570 |
Diploma or GED | 1233 | 12043 | 30130 | |
Some College | 1182 | 11627 | 27639 | |
Assoc. Degree | 451 | 5223 | 12722 | |
Bachelors Degree | 614 | 9268 | 28602 | |
Higher Degree | 342 | 4723 | 15286 | |
Total Housing Units | 2,832 | 26,794 | 65,834 | |
--Owner-Occupied | 944 | 14,943 | 45,401 | |
--Renter-Occupied | 1,710 | 10,384 | 17,700 | |
Owner-Occupied Values | < 100K | 142 | 1079 | 2081 |
100-199K | 433 | 7755 | 19211 | |
200-299K | 228 | 4816 | 16228 | |
300-399K | 109 | 1028 | 5345 | |
400-499K | 13 | 98 | 1394 | |
500K+ | 19 | 168 | 1141 | |
Total Working Age Population | 5,400 | 60,792 | 156,644 | |
In Work Force | 3,809 | 41,355 | 107,084 | |
Not In Work Force | 1,592 | 19,437 | 49,560 | |
Workforce Employed | 3,597 | 38,576 | 101,271 | |
Workforce Unemployed | 212 | 2,667 | 5,635 | |
Civlian Workforce | 3,809 | 41,243 | 106,906 | |
Military Workforce | 0 | 112 | 178 | |
Total Households | 2,654 | 25,327 | 63,101 | |
Family Households | 1,768 | 18,445 | 49,139 | |
Non-Family Households | 886 | 6,882 | 13,962 | |
Married Couple | 1,115 | 12,626 | 36,475 | |
Other Family | 653 | 5,819 | 12,664 | |
Married w/Child | 505 | 5,899 | 17,491 | |
Single Male w/Child | 79 | 468 | 1,284 | |
Single Female w/Child | 337 | 2,763 | 5,464 |
Population Change Last Two Decades - Plus Projection
2000 | % | 2010 | % | 2020 | % | 2030 | |
---|---|---|---|---|---|---|---|
Georgia | 8,186,453 | +18 | 9,687,653 | +12 | 10,833,472 | +13 | 12,292,423 |
DeKalb County | 665,865 | +4 | 691,893 | +15 | 793,154 | +19 | 944,045 |
Gwinnett County | 588,448 | +37 | 805,321 | +21 | 971,145 | +21 | 1,175,358 |
Walton County | 60,687 | +38 | 83,768 | +14 | 95,814 | +14 | 109,179 |
Total Working Age Population:
Total Households:
Total Working Age Population:
Total Households:
Total Working Age Population:
Total Households: