Office Space
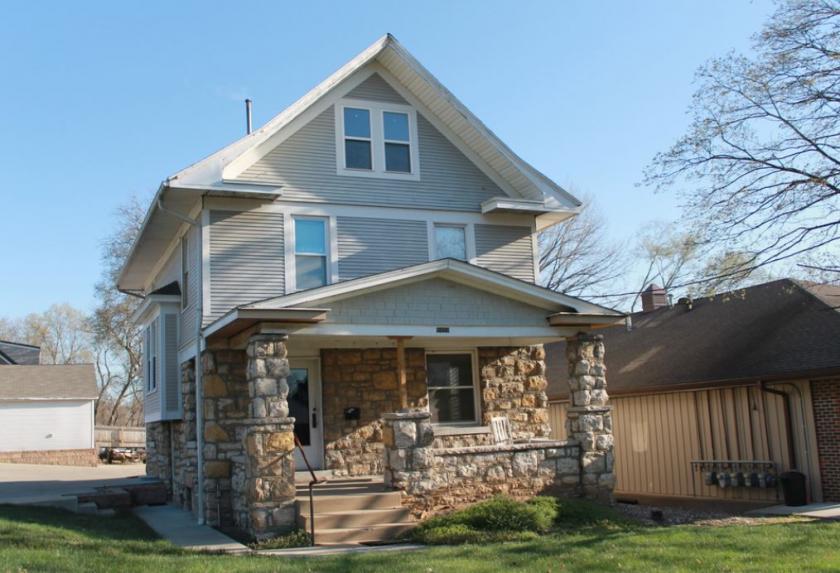
9424 Johnson Drive Shawnee, KS 66203
9424 Johnson Drive Shawnee, KS 66203
Details & Description
Property Highlights
- • Super recognizable North Johnson County property
- • Built in 1912
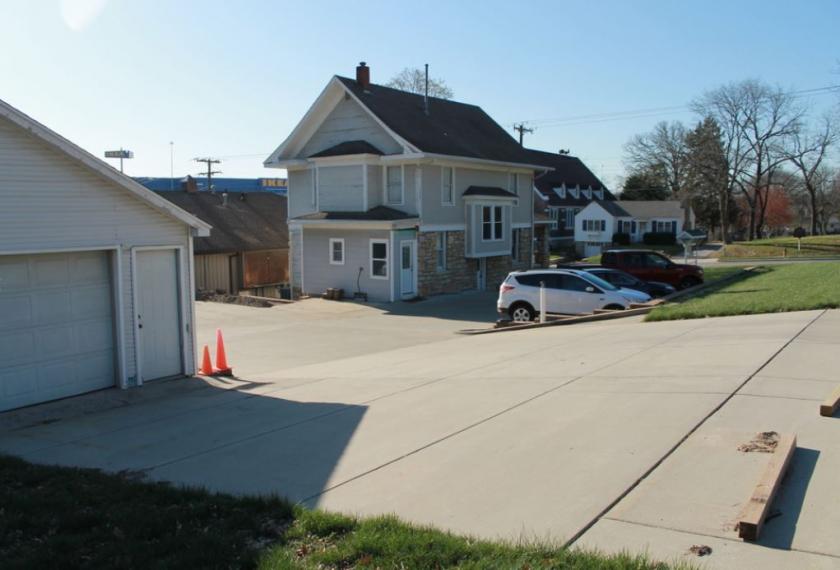
- • Outstanding I-35 access
- • Well maintained
- • On-site irrigation system
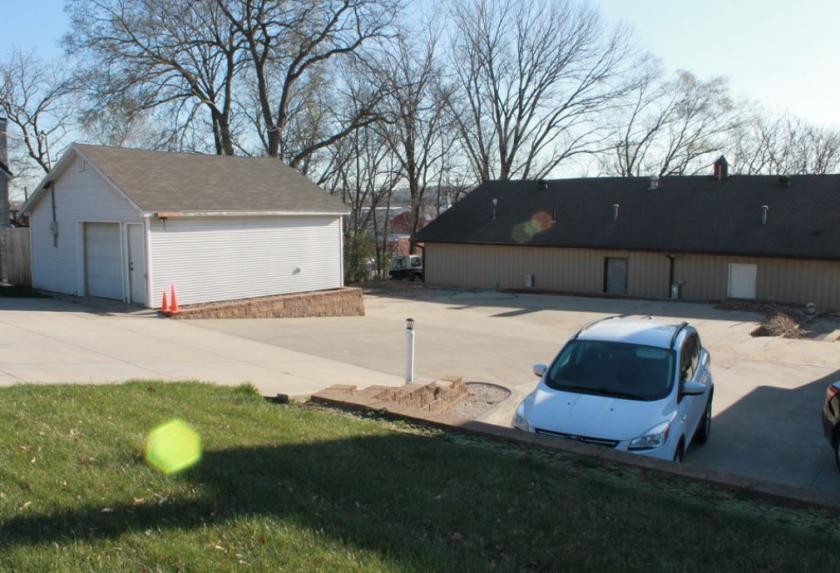
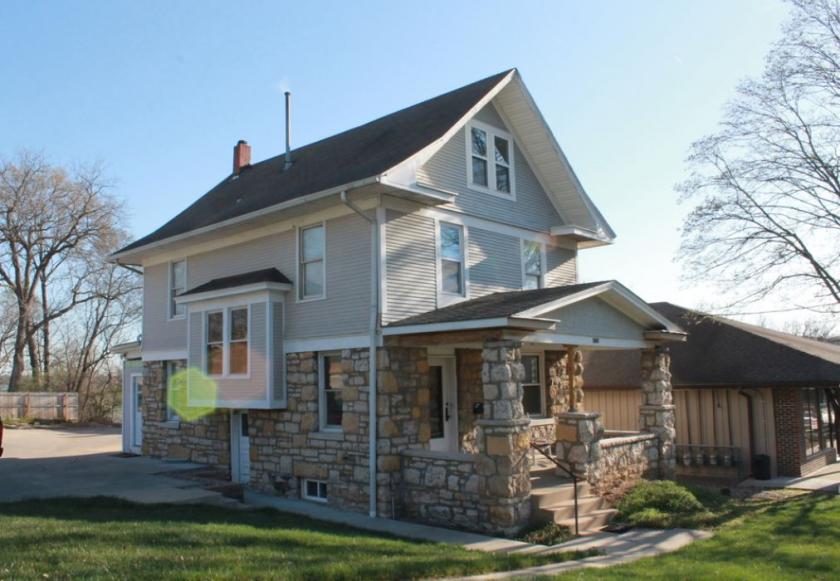
Additional Photos
Listing Agents

Paul Byers
KW Commercial
O: 913-909-9700
paulbyers@kwcommercial.com
KW Commercial
O: 913-909-9700
paulbyers@kwcommercial.com
While we strive to provide the most accurate information, all listing information, and demographic data, is provided by third-parties. As such, MyEListing will not be responsible for the accuracy of the information. It is strongly recommended that you verify all information with the listing agent, and any relevant agencies, prior to making any decisions.


