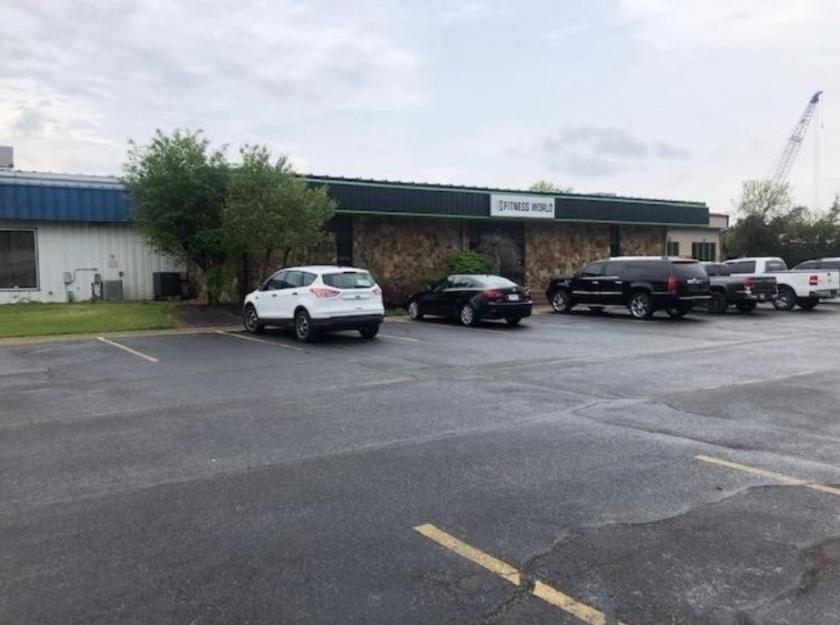
Specialty Real Estate
1101 North Congress Avenue Evansville, IN 47715
1101 North Congress Avenue Evansville, IN 47715
Details & Description
Property Highlights
- • Centrally located
- • Easy access to and from Highway 6266
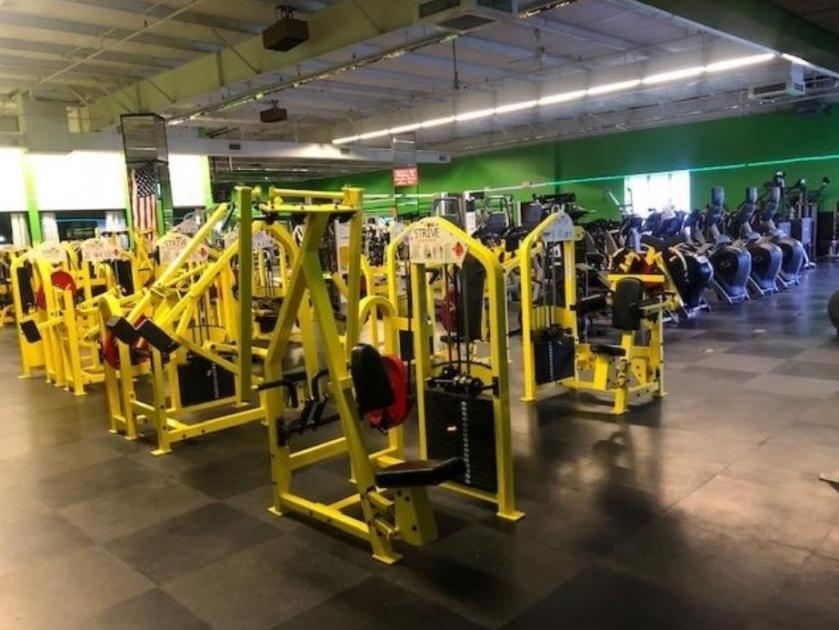
- • Clean, well known fitness center
- • Loading dock
- • Upgraded electrical
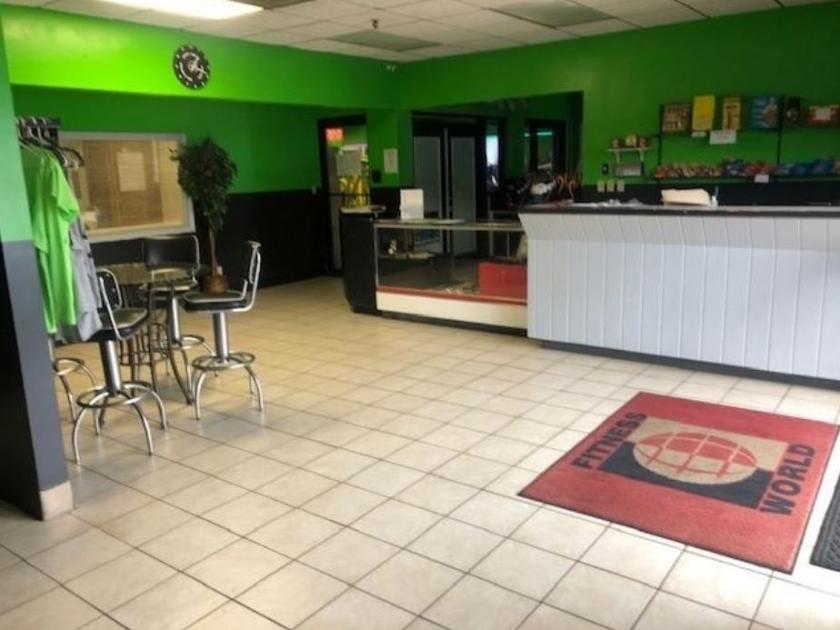
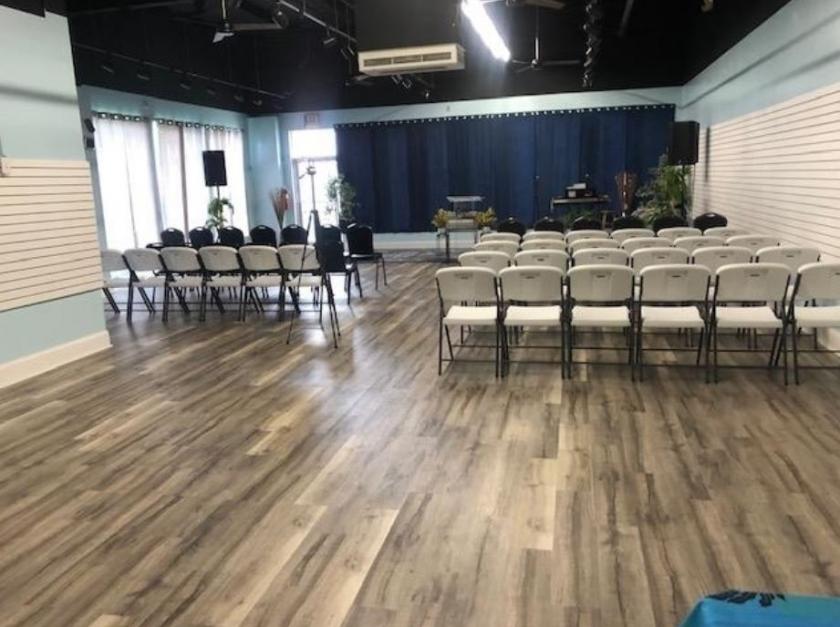
Additional Photos
Listing Agents

Charlie Butler
O: 812-449-0050
cbutler@kwcommercial.com
O: 812-449-0050
cbutler@kwcommercial.com
While we strive to provide the most accurate information, all listing information, and demographic data, is provided by third-parties. As such, MyEListing will not be responsible for the accuracy of the information. It is strongly recommended that you verify all information with the listing agent, and any relevant agencies, prior to making any decisions.


