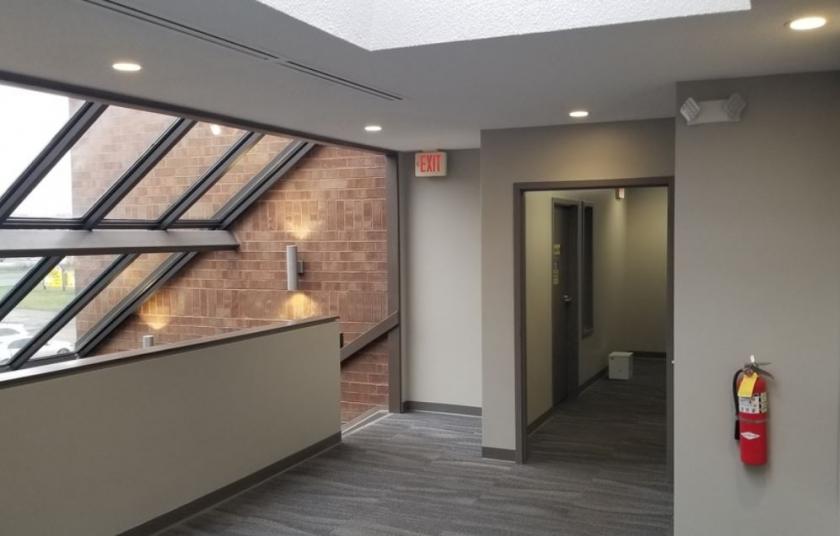
1-Mile | 3-Miles | 5-Miles | ||
---|---|---|---|---|
Total Population | 8,564 | 60,061 | 189,379 | |
Population Median Age | 39 | 38 | 38 | |
Population by Age | 0-9 Yrs | 774 (9%) | 7067 (11%) | 23577 (12%) |
10-19 Yrs | 1209 (14%) | 6744 (11%) | 22500 (11%) | |
20-29 Yrs | 1237 (14%) | 9881 (16%) | 28635 (15%) | |
30-39 Yrs | 1404 (16%) | 9697 (16%) | 27883 (14%) | |
40-49 Yrs | 1193 (13%) | 6441 (10%) | 22340 (11%) | |
50-59 Yrs | 1015 (11%) | 7547 (12%) | 24796 (13%) | |
60-69 Yrs | 939 (10%) | 7000 (11%) | 21547 (11%) | |
70+ Yrs | 792 (9%) | 5684 (9%) | 18101 (9%) | |
Median HH Income | $49,454 | $59,132 | $59,250 | |
Total Household Income | < 24K | 746 (18%) | 4344 (16%) | 15377 (18%) |
25-49K | 1342 (32%) | 7032 (25%) | 19906 (24%) | |
50-74K | 920 (22%) | 4990 (18%) | 13558 (16%) | |
75-99K | 444 (10%) | 3268 (12%) | 9704 (11%) | |
100-199K | 545 (13%) | 5784 (21%) | 16912 (20%) | |
200K+ | 134 (3%) | 1732 (6%) | 5869 (7%) | |
Highest Education Level | No Diploma | 289 | 1739 | 10410 |
Diploma or GED | 1239 | 7820 | 26911 | |
Some College | 1211 | 8234 | 23721 | |
Assoc. Degree | 443 | 2920 | 9432 | |
Bachelors Degree | 1744 | 13704 | 39690 | |
Higher Degree | 990 | 8156 | 22054 | |
Total Housing Units | 4,486 | 28,780 | 88,492 | |
--Owner-Occupied | 1,547 | 14,308 | 46,755 | |
--Renter-Occupied | 2,583 | 12,841 | 34,571 | |
Owner-Occupied Values | < 100K | 35 | 845 | 7672 |
100-199K | 745 | 7231 | 19343 | |
200-299K | 555 | 3353 | 10198 | |
300-399K | 175 | 1444 | 5023 | |
400-499K | 7 | 663 | 2130 | |
500K+ | 30 | 772 | 2389 | |
Total Working Age Population | 6,978 | 48,753 | 151,039 | |
In Work Force | 4,965 | 35,137 | 106,365 | |
Not In Work Force | 2,012 | 13,617 | 44,674 | |
Workforce Employed | 4,785 | 33,497 | 100,232 | |
Workforce Unemployed | 180 | 1,609 | 6,004 | |
Civlian Workforce | 4,965 | 35,107 | 106,236 | |
Military Workforce | 0 | 30 | 129 | |
Total Households | 4,131 | 27,149 | 81,326 | |
Family Households | 1,702 | 13,440 | 43,473 | |
Non-Family Households | 2,429 | 13,709 | 37,853 | |
Married Couple | 1,166 | 9,932 | 31,213 | |
Other Family | 536 | 3,508 | 12,260 | |
Married w/Child | 556 | 3,441 | 11,158 | |
Single Male w/Child | 40 | 412 | 1,349 | |
Single Female w/Child | 221 | 1,705 | 5,926 |
Population Change Last Two Decades - Plus Projection
2000 | % | 2010 | % | 2020 | % | 2030 | |
---|---|---|---|---|---|---|---|
Indiana | 6,080,485 | +7 | 6,483,802 | +4 | 6,738,573 | +4 | 7,014,880 |
Hamilton County | 182,740 | +50 | 274,569 | +25 | 343,179 | +22 | 417,754 |
Hancock County | 55,391 | +26 | 70,002 | +9 | 76,353 | +11 | 85,043 |
Marion County | 860,454 | +5 | 903,393 | +7 | 963,732 | +4 | 1,001,231 |
Total Working Age Population:
Total Households:
Total Working Age Population:
Total Households:
Total Working Age Population:
Total Households: