Commercial Land
9097 Canyon Gate Road Sandy, UT 84093
9097 Canyon Gate Road Sandy, UT 84093
Details & Description
Property Highlights
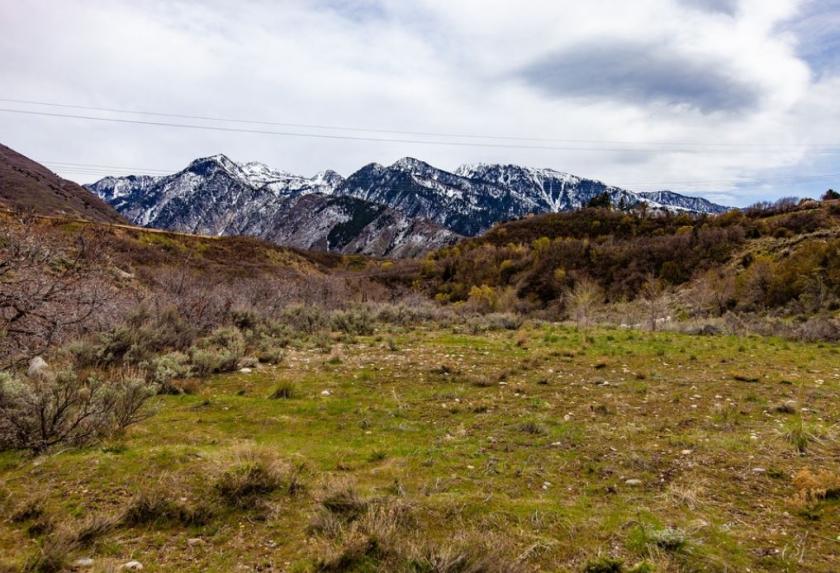
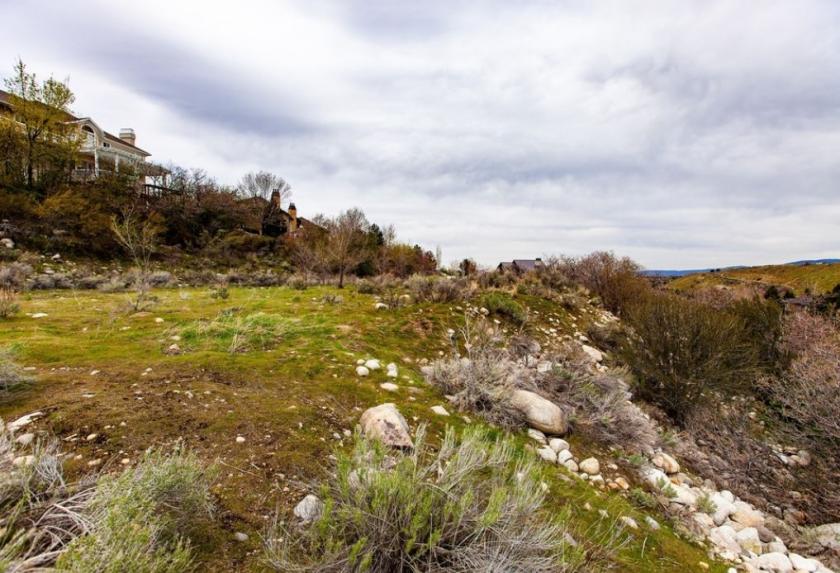
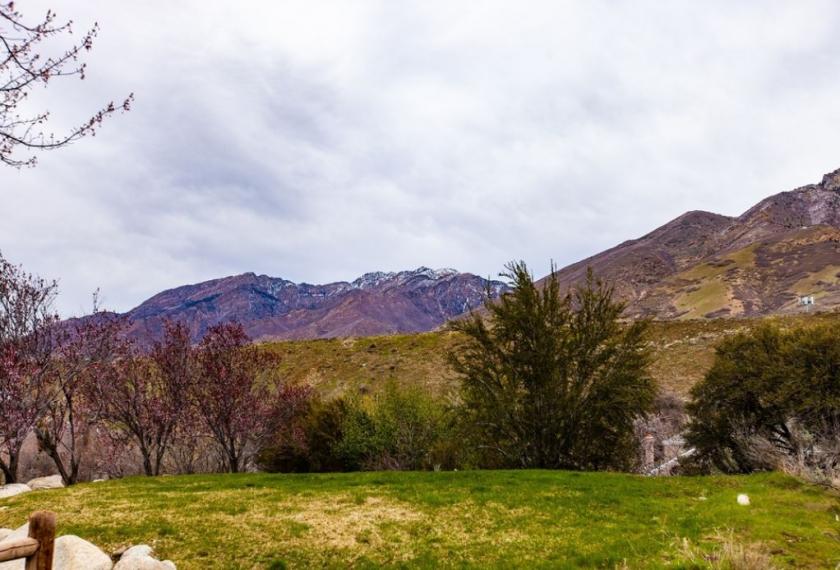
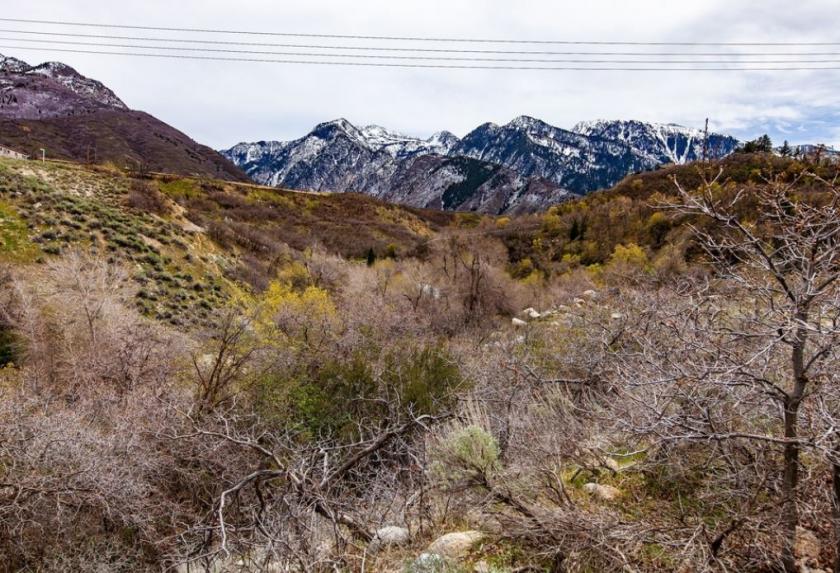
• Secluded Luxury lot in Willow Creek Canyon Estates Subdivision
• Amazing Views of the Wasatch Mountains
Additional Photos
Listing Agents

Boyd Brown
KW Boyd Brown Team
O: 801-326-8886
M: 801-598-5838
boyd@kw.com
KW Boyd Brown Team
O: 801-326-8886
M: 801-598-5838
boyd@kw.com
While we strive to provide the most accurate information, all listing information, and demographic data, is provided by third-parties. As such, MyEListing will not be responsible for the accuracy of the information. It is strongly recommended that you verify all information with the listing agent, and any relevant agencies, prior to making any decisions.


