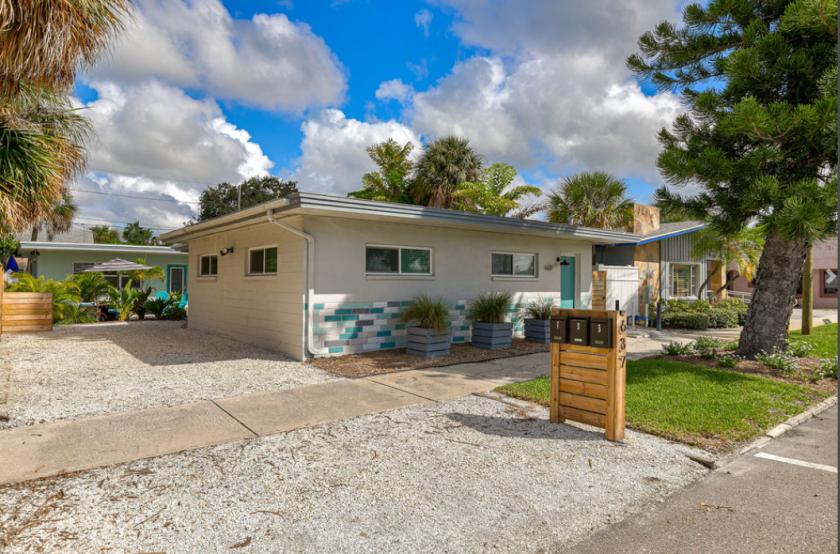
Newly renovated, turn-key mid-century St. Pete Beach retreat. A true retreat with its new modern beach decor. Located just off of historic Corey Ave. with walking, biking, or a short driving distance to everything St Pete Beach area has to offer! This space has everything you need to ensure guests have a great escape to paradise.
The Spaces:
Building 1: 2 – 1 Bedroom, 1 bath units (approx. 630 sqft each).
Building 2: 2 – 1 Bedroom, 1 bath units (approx. 600 sqft and 400 sqft).
Building 1: 2 units.
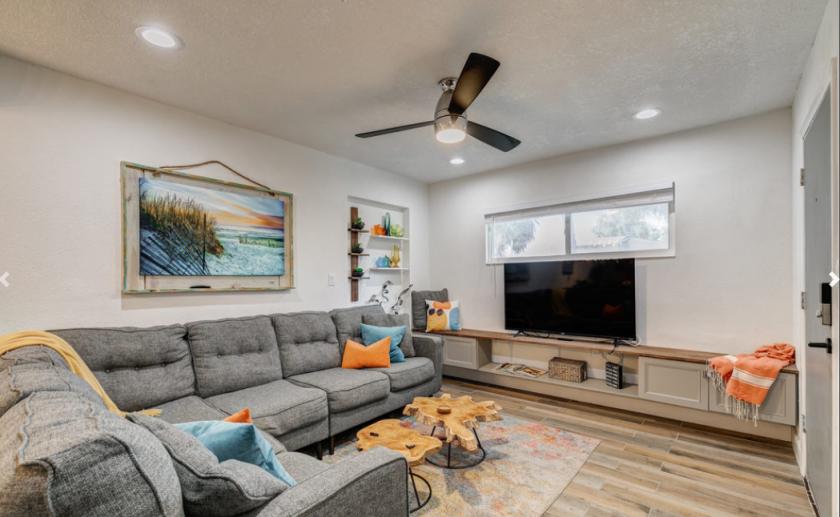
Unit 2: 650sq ft 1 Bedroom with King bed, large walk-in closet, and original 1956 built-ins. 1 three-piece bathroom. Roomy open living area. Fully equipped kitchen with new stainless steal appliances and dining area.
Unit 3: Identical layout as Unit 2, but mirrored. 650sq ft 1 Bedroom with King bed, large walk-in closet, and original 1956 built-ins. 1 three-piece bathroom. Roomy open living area. Fully equipped kitchen with new stainless steal appliances and dining area.
Building 2: 2 units.
Unit 1: 1 bedroom, 1 bathroom owners unit is decked out to the hilt. No expense spared on the completed renovation. Must see to believe!
Unit 4: 1 bedroom, 1 bathroom unit. This is the only unit of the 4 that needs some updating. Add a full kitchen, paint and add new floors (maybe $10k?) to see the rental income jump!
Outdoor Space: Shared courtyard with separate seating and dining areas along with private fenced backyard seating in Units 2 and 3 as well.
Current guest access:
The front door has an electronic lock, the key code is currently provided before arrival to guests. There is plenty of free on-street parking at the front of the house as well as several off-street spaces.
The intercoastal is just steps away from the property with great fishing, beach is a short walk or bike ride away, 20+ bars/restaurants within 6 blocks plus all that St Pete Beach has to offer!
Income Model:
Owners have not rented Unit 1 or Unit 4 before. They have lived in Unit 1 and have had family living in Unit 4. Additionally, several of the properties have been off-line for renovation within the last 12 months, skewing the potential income. In addition, the current owners have extended Units 2/3 to family during certain months without cost, further skewing the potential income.
The pro-forma NOI on rents was run at full availability together with different levels of occupancy. The new estimated tax has been included to produce a true to life estimate of expected NOI with a knowledgeable investor running the property for income.