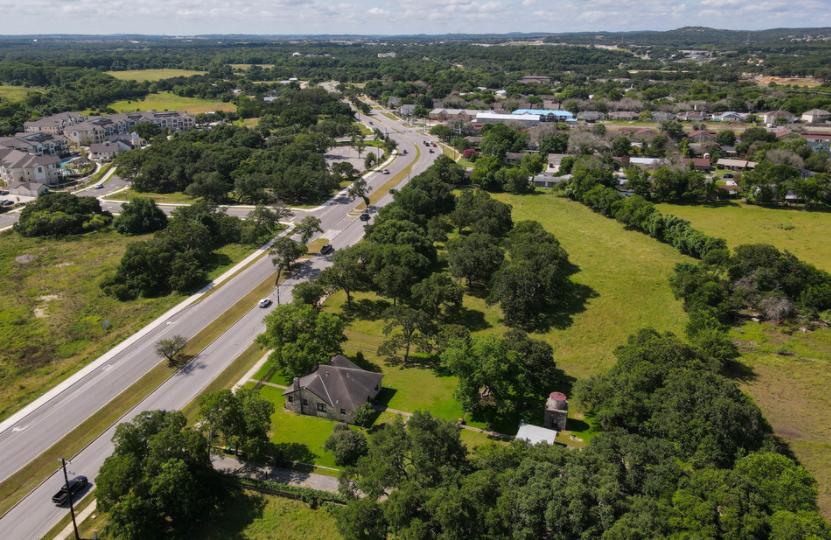
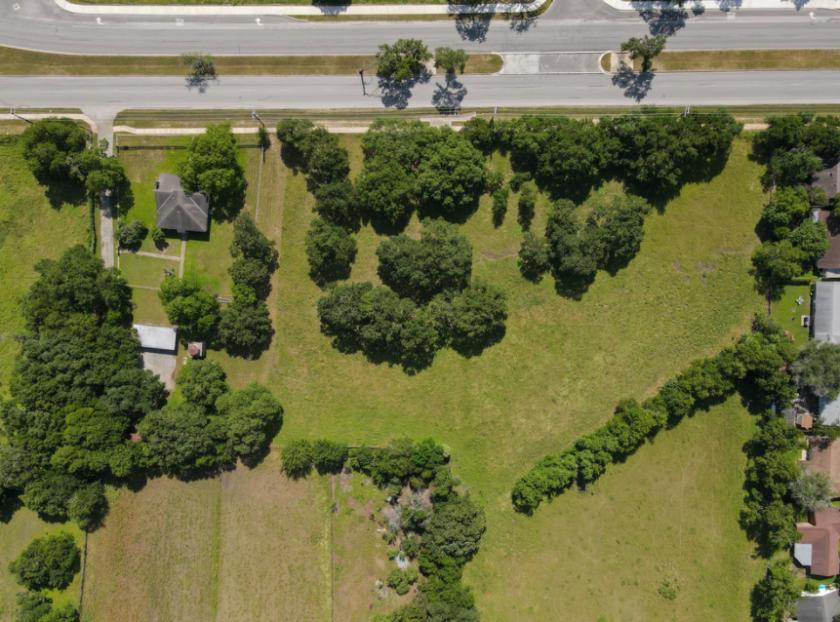
1-Mile | 3-Miles | 5-Miles | ||
---|---|---|---|---|
Total Population | 4,899 | 16,638 | 25,568 | |
Population Median Age | 39 | 39 | 40 | |
Population by Age | 0-9 Yrs | 753 (15%) | 2156 (12%) | 3203 (12%) |
10-19 Yrs | 574 (11%) | 2775 (16%) | 4166 (16%) | |
20-29 Yrs | 657 (13%) | 1796 (10%) | 2317 (9%) | |
30-39 Yrs | 647 (13%) | 2019 (12%) | 3046 (11%) | |
40-49 Yrs | 383 (7%) | 2077 (12%) | 3149 (12%) | |
50-59 Yrs | 649 (13%) | 1993 (11%) | 3446 (13%) | |
60-69 Yrs | 555 (11%) | 1570 (9%) | 2685 (10%) | |
70+ Yrs | 681 (13%) | 2252 (13%) | 3555 (13%) | |
Median HH Income | $61,762 | $72,467 | $82,006 | |
Total Household Income | < 24K | 309 (17%) | 757 (13%) | 1020 (11%) |
25-49K | 412 (23%) | 1110 (20%) | 1571 (18%) | |
50-74K | 297 (17%) | 1015 (18%) | 1422 (16%) | |
75-99K | 255 (14%) | 762 (13%) | 1126 (13%) | |
100-199K | 322 (18%) | 1341 (24%) | 2347 (27%) | |
200K+ | 129 (7%) | 562 (10%) | 1172 (13%) | |
Highest Education Level | No Diploma | 247 | 631 | 780 |
Diploma or GED | 771 | 2016 | 3096 | |
Some College | 974 | 2780 | 4240 | |
Assoc. Degree | 293 | 984 | 1372 | |
Bachelors Degree | 709 | 3010 | 4924 | |
Higher Degree | 321 | 1446 | 2694 | |
Total Housing Units | 1,832 | 5,986 | 9,394 | |
--Owner-Occupied | 831 | 3,162 | 5,809 | |
--Renter-Occupied | 894 | 2,386 | 2,850 | |
Owner-Occupied Values | < 100K | 31 | 105 | 288 |
100-199K | 120 | 393 | 580 | |
200-299K | 269 | 1035 | 1493 | |
300-399K | 247 | 786 | 1333 | |
400-499K | 98 | 273 | 788 | |
500K+ | 67 | 570 | 1327 | |
Total Working Age Population | 3,831 | 12,675 | 19,676 | |
In Work Force | 2,460 | 7,893 | 11,853 | |
Not In Work Force | 1,371 | 4,782 | 7,823 | |
Workforce Employed | 2,439 | 7,698 | 11,524 | |
Workforce Unemployed | 19 | 177 | 306 | |
Civlian Workforce | 2,459 | 7,876 | 11,830 | |
Military Workforce | 1 | 17 | 23 | |
Total Households | 1,725 | 5,547 | 8,658 | |
Family Households | 1,151 | 4,081 | 6,480 | |
Non-Family Households | 574 | 1,466 | 2,178 | |
Married Couple | 719 | 3,032 | 5,161 | |
Other Family | 432 | 1,050 | 1,319 | |
Married w/Child | 301 | 1,383 | 2,202 | |
Single Male w/Child | 31 | 166 | 199 | |
Single Female w/Child | 244 | 551 | 694 |
Population Change Last Two Decades - Plus Projection
2000 | % | 2010 | % | 2020 | % | 2030 | |
---|---|---|---|---|---|---|---|
Texas | 20,851,820 | +21 | 25,145,561 | +18 | 29,677,668 | +18 | 34,894,452 |
Bandera County | 17,645 | +16 | 20,485 | +4 | 21,246 | +2 | 21,653 |
Bexar County | 1,392,931 | +23 | 1,714,773 | +22 | 2,093,502 | +20 | 2,502,617 |
Comal County | 78,021 | +39 | 108,472 | +36 | 147,330 | +39 | 204,873 |
Kendall County | 23,743 | +41 | 33,410 | +39 | 46,278 | +46 | 67,443 |
Total Working Age Population:
Total Households:
Total Working Age Population:
Total Households:
Total Working Age Population:
Total Households: