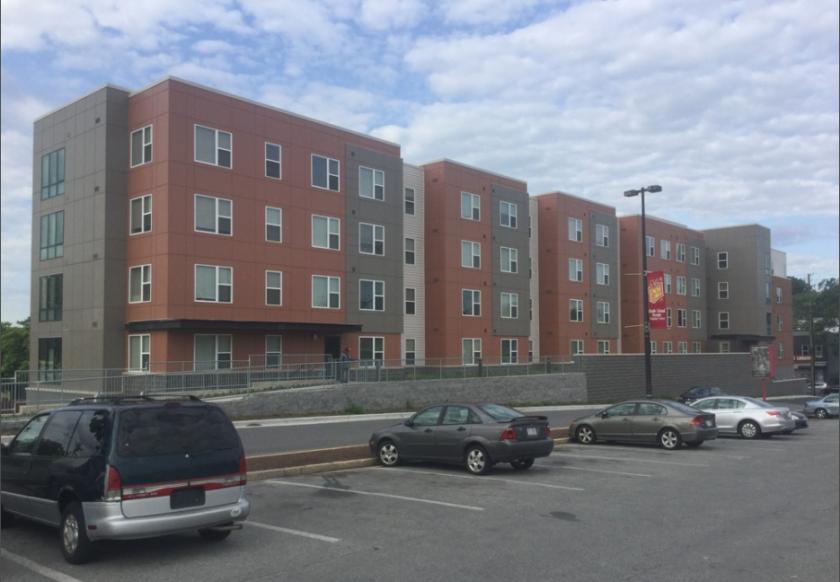
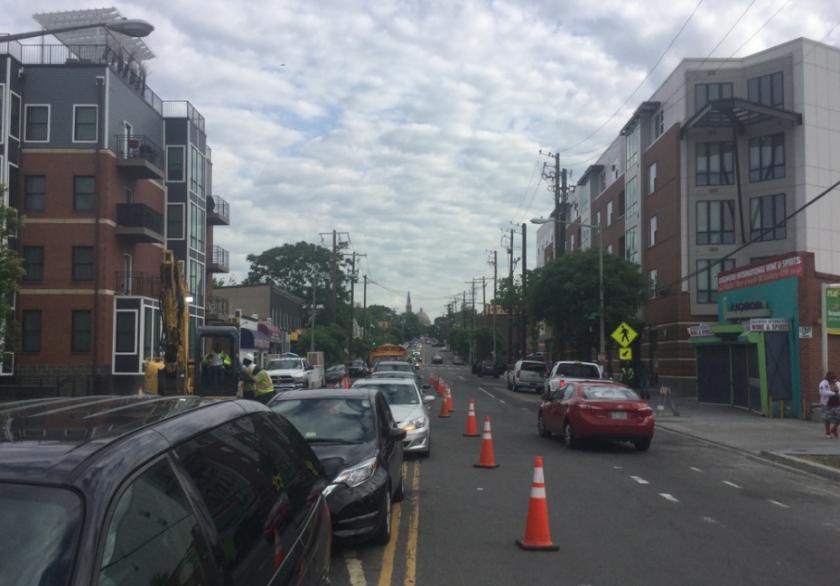
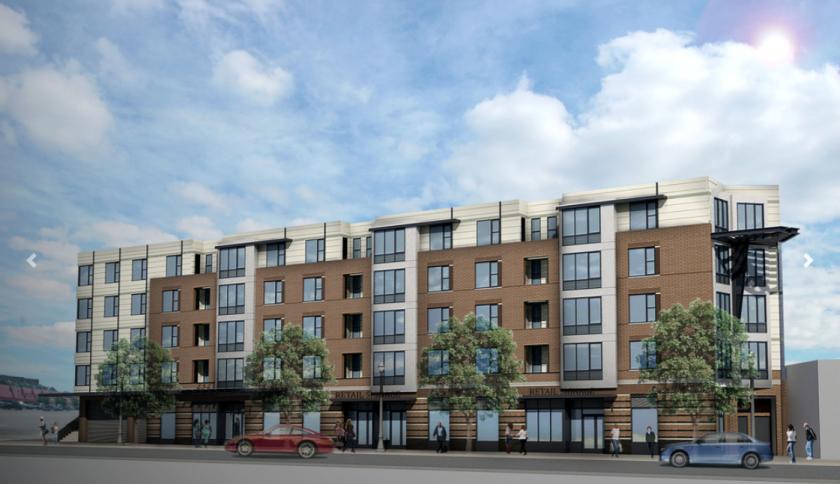
1-Mile | 3-Miles | 5-Miles | ||
---|---|---|---|---|
Total Population | 37,705 | 397,458 | 797,926 | |
Population Median Age | 35 | 37 | 37 | |
Population by Age | 0-9 Yrs | 3082 (8%) | 39474 (9%) | 91064 (11%) |
10-19 Yrs | 4084 (10%) | 29558 (7%) | 73219 (9%) | |
20-29 Yrs | 9261 (24%) | 86181 (21%) | 156773 (19%) | |
30-39 Yrs | 8255 (21%) | 93292 (23%) | 162354 (20%) | |
40-49 Yrs | 4226 (11%) | 48349 (12%) | 96379 (12%) | |
50-59 Yrs | 3828 (10%) | 40437 (10%) | 86140 (10%) | |
60-69 Yrs | 2772 (7%) | 31936 (8%) | 70186 (8%) | |
70+ Yrs | 2197 (5%) | 28230 (7%) | 61811 (7%) | |
Median HH Income | $82,404 | $97,891 | $87,784 | |
Total Household Income | < 24K | 2882 (19%) | 25621 (15%) | 54958 (16%) |
25-49K | 2050 (14%) | 20995 (12%) | 45048 (13%) | |
50-74K | 1782 (12%) | 20498 (12%) | 43184 (13%) | |
75-99K | 1724 (11%) | 18546 (11%) | 37215 (11%) | |
100-199K | 3712 (25%) | 51248 (30%) | 89005 (27%) | |
200K+ | 2299 (15%) | 31287 (18%) | 55035 (16%) | |
Highest Education Level | No Diploma | 2369 | 28807 | 66222 |
Diploma or GED | 4494 | 41561 | 94308 | |
Some College | 3097 | 32257 | 70226 | |
Assoc. Degree | 768 | 8073 | 18314 | |
Bachelors Degree | 8086 | 84546 | 139852 | |
Higher Degree | 7885 | 104521 | 183170 | |
Total Housing Units | 16,141 | 185,928 | 357,785 | |
--Owner-Occupied | 5,873 | 68,431 | 135,128 | |
--Renter-Occupied | 8,576 | 99,764 | 189,316 | |
Owner-Occupied Values | < 100K | 69 | 1124 | 2970 |
100-199K | 53 | 1055 | 5533 | |
200-299K | 364 | 4237 | 16241 | |
300-399K | 524 | 8740 | 20995 | |
400-499K | 706 | 10023 | 17589 | |
500K+ | 4157 | 43253 | 71801 | |
Total Working Age Population | 33,006 | 343,375 | 667,878 | |
In Work Force | 23,364 | 256,362 | 481,128 | |
Not In Work Force | 9,642 | 87,013 | 186,750 | |
Workforce Employed | 21,908 | 241,783 | 449,499 | |
Workforce Unemployed | 1,396 | 13,224 | 28,615 | |
Civlian Workforce | 23,305 | 255,007 | 478,114 | |
Military Workforce | 60 | 1,356 | 3,014 | |
Total Households | 14,449 | 168,195 | 324,445 | |
Family Households | 5,681 | 65,432 | 143,741 | |
Non-Family Households | 8,768 | 102,763 | 180,704 | |
Married Couple | 3,182 | 43,227 | 88,855 | |
Other Family | 2,499 | 22,206 | 54,886 | |
Married w/Child | 1,036 | 15,734 | 33,790 | |
Single Male w/Child | 145 | 2,116 | 5,801 | |
Single Female w/Child | 1,039 | 7,214 | 19,334 |
Population Change Last Two Decades - Plus Projection
2000 | % | 2010 | % | 2020 | % | 2030 | |
---|---|---|---|---|---|---|---|
District of Columbia | 572,059 | +5 | 601,723 | +21 | 729,501 | +15 | 842,154 |
Maryland | 5,296,486 | +9 | 5,773,552 | +6 | 6,141,900 | +6 | 6,518,750 |
Montgomery County | 873,341 | +11 | 971,777 | +8 | 1,052,050 | +7 | 1,128,800 |
Prince Georges County | 801,515 | +8 | 863,420 | +6 | 916,150 | +4 | 952,950 |
Virginia | 7,078,515 | +13 | 8,001,024 | +8 | 8,655,021 | +8 | 9,331,666 |
Arlington County | 189,453 | +10 | 207,627 | +20 | 249,298 | +10 | 274,339 |
Fairfax County | 969,749 | +12 | 1,081,726 | +7 | 1,162,504 | +7 | 1,244,025 |
Total Working Age Population:
Total Households:
Total Working Age Population:
Total Households:
Total Working Age Population:
Total Households: