Retail Space
1 North 7th Street Perkasie, PA 18944
1 North 7th Street Perkasie, PA 18944
Details & Description
Property Highlights
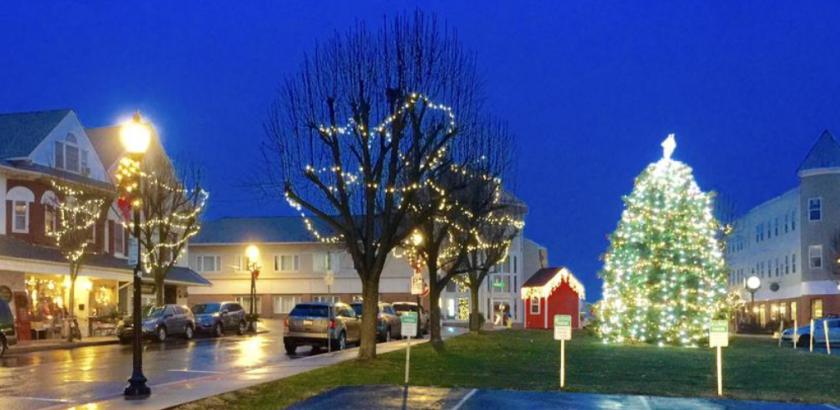
- • Great Perkasie Square Location
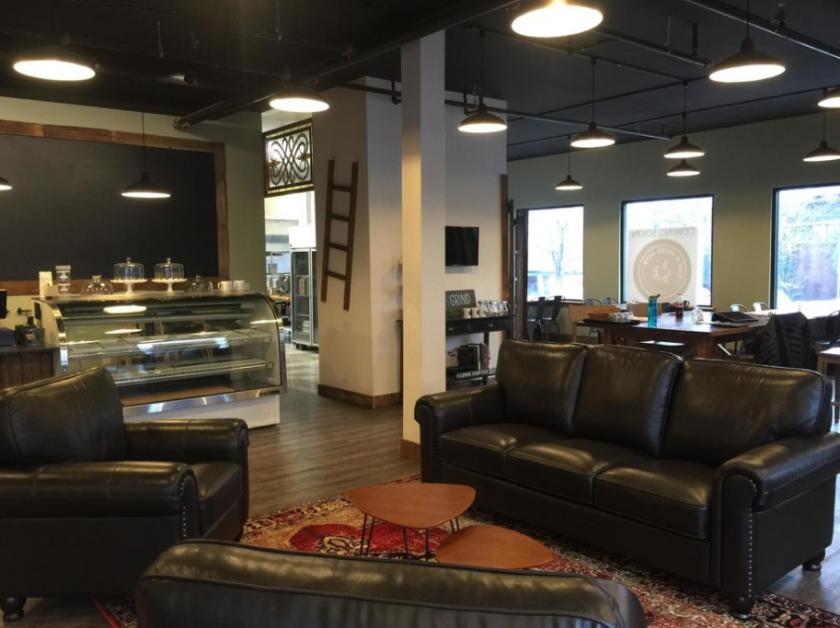
- • FFE for Full-Service Restaurant
- • Corner of Market and 7th Street
- • Just off SEPTA Train Station
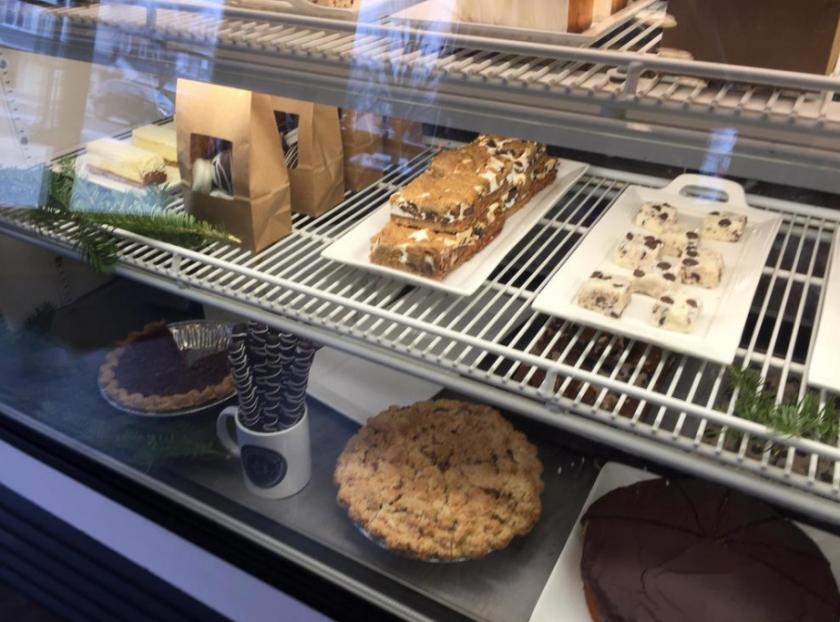
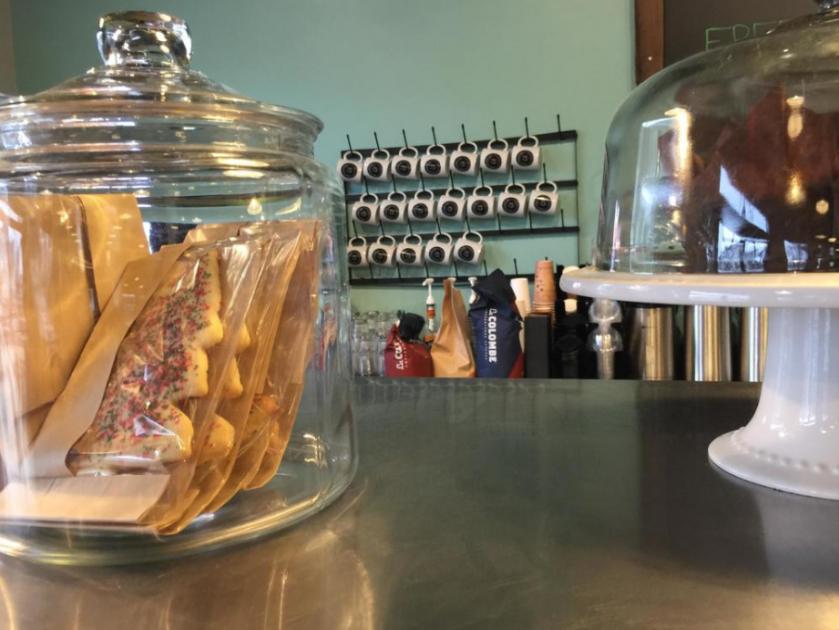
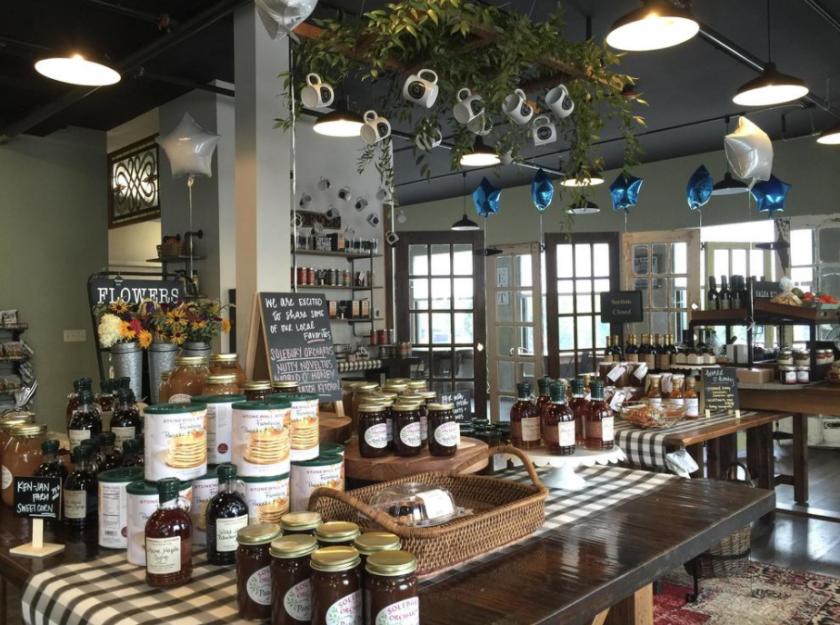
Additional Photos
Listing Agents

Eric Cornwall
KW Commercial
O: 215-340-5700
M: 215-512-1462
erc@cornwell.co
KW Commercial
O: 215-340-5700
M: 215-512-1462
erc@cornwell.co
While we strive to provide the most accurate information, all listing information, and demographic data, is provided by third-parties. As such, MyEListing will not be responsible for the accuracy of the information. It is strongly recommended that you verify all information with the listing agent, and any relevant agencies, prior to making any decisions.


