Commercial Land
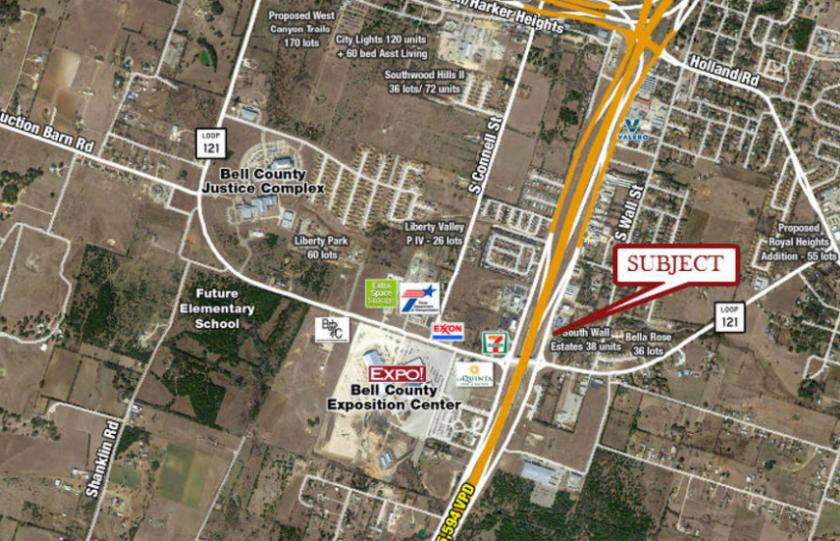
2608 S Hwy Blvd Belton, TX 76513
2608 S Hwy Blvd Belton, TX 76513
Details & Description
Property Highlights
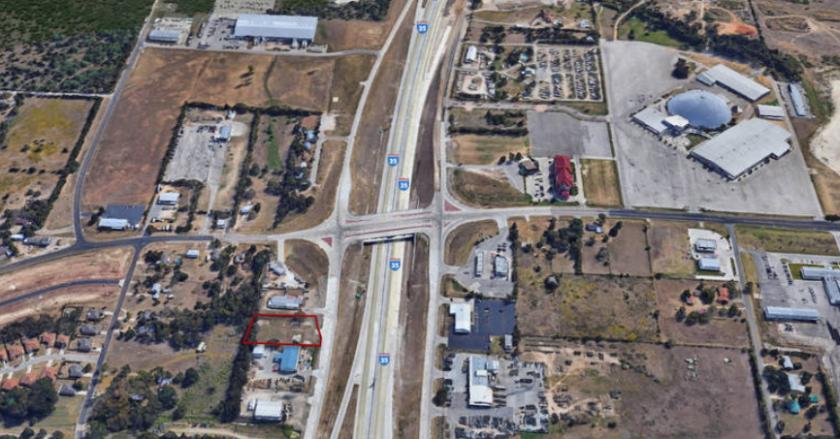
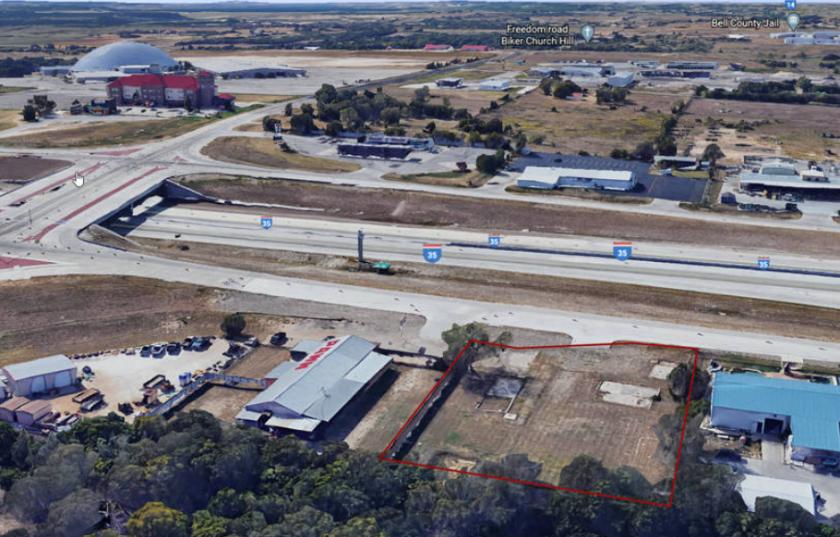
- • High Visibility
- • 75,594 Vehicles Per Day
- • Existing Curb Cut
- • Utilities to Site
Listing Agents

Courtney Bassi
O: 254-833-3817
ladypeshkova@gmail.com
O: 254-833-3817
ladypeshkova@gmail.com
While we strive to provide the most accurate information, all listing information, and demographic data, is provided by third-parties. As such, MyEListing will not be responsible for the accuracy of the information. It is strongly recommended that you verify all information with the listing agent, and any relevant agencies, prior to making any decisions.