Commercial Land
4100 Belcher Drive Birmingham, AL 35242
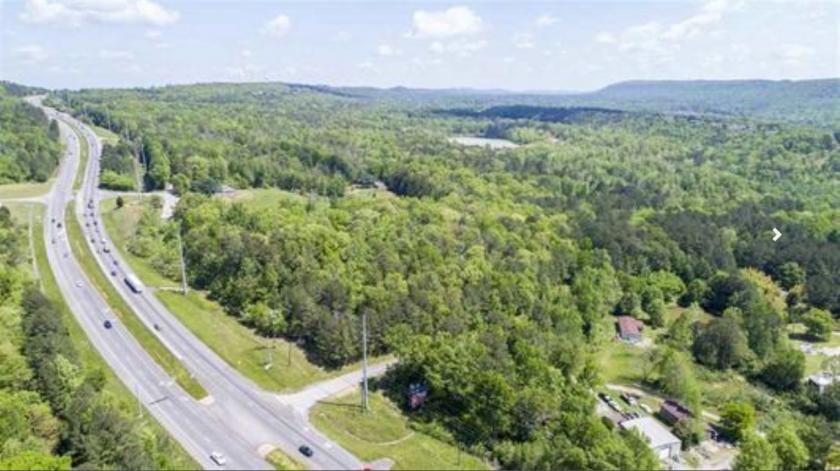
4100 Belcher Drive Birmingham, AL 35242

Details & Description
Property Highlights
• Land, Highway Frontage, High Traffic
• Land, Highway Frontage, High Traffic
Listing Agents

Phyllis Bolena
KW Commercial
O: 205-240-8066
pbolena@kw.com
KW Commercial
O: 205-240-8066
pbolena@kw.com
While we strive to provide the most accurate information, all listing information, and demographic data, is provided by third-parties. As such, MyEListing will not be responsible for the accuracy of the information. It is strongly recommended that you verify all information with the listing agent, and any relevant agencies, prior to making any decisions.