Industrial Properties
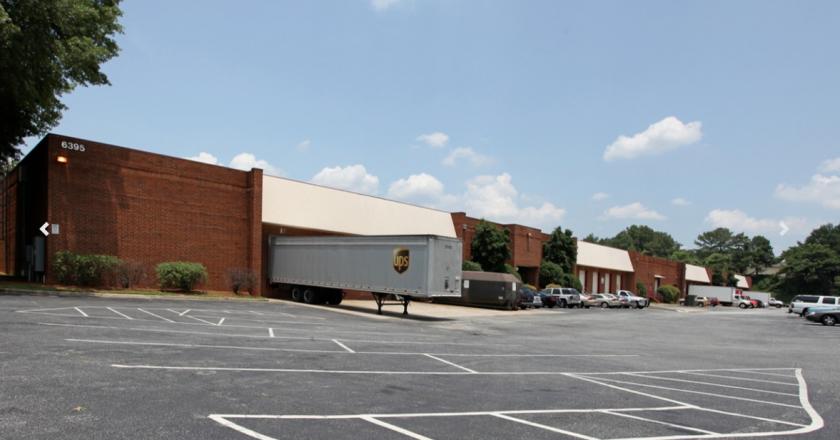
6395 McDonough Drive Northwest Norcross, GA 30093
6395 McDonough Drive Northwest Norcross, GA 30093
Details & Description
Property Highlights
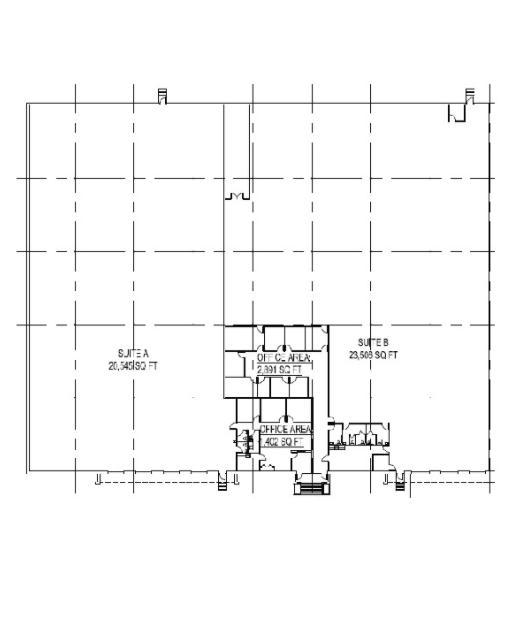
• Parking Suites have 4-5 car parking spaces directly in front of the office, with additional parking on left of property
• Suite B 23,320 square feet with 2,891 square feet office and three 3 dock high doors.
Listing Agents

Josephine Chang
KW Commercial
O: 678-495-1874
M: 404-218-8330
josephinechang@kw.com
KW Commercial
O: 678-495-1874
M: 404-218-8330
josephinechang@kw.com
While we strive to provide the most accurate information, all listing information, and demographic data, is provided by third-parties. As such, MyEListing will not be responsible for the accuracy of the information. It is strongly recommended that you verify all information with the listing agent, and any relevant agencies, prior to making any decisions.