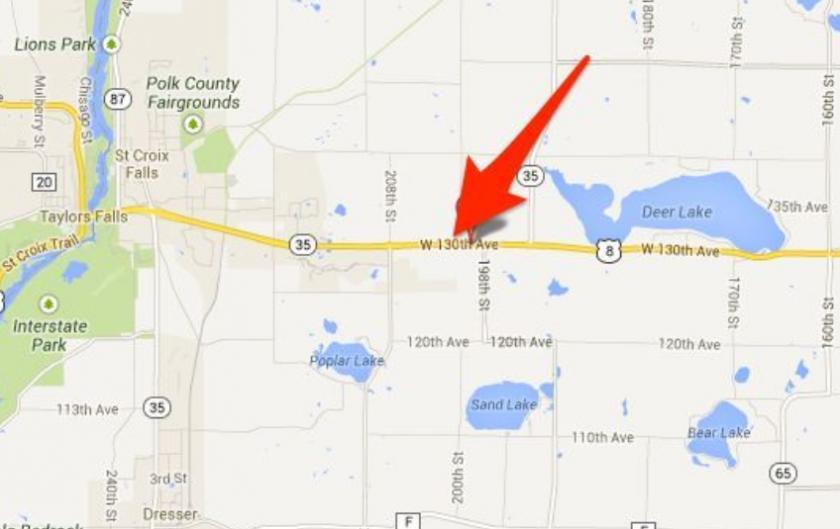
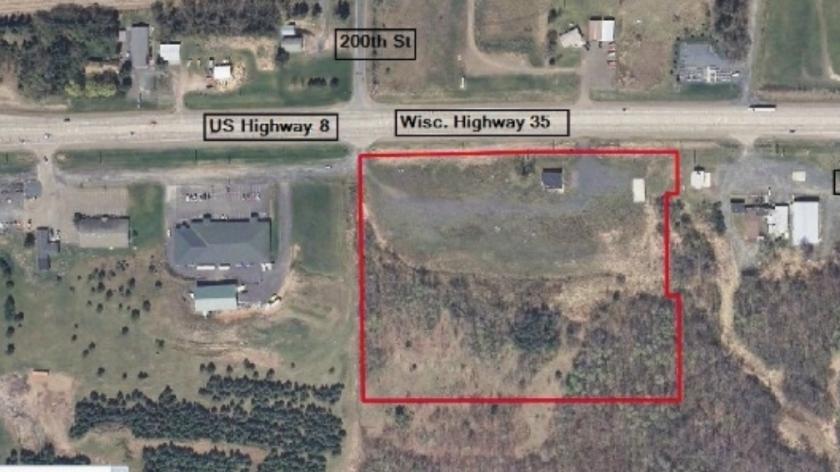
1-Mile | 3-Miles | 5-Miles | ||
---|---|---|---|---|
Total Population | 278 | 2,503 | 8,071 | |
Population Median Age | 42 | 42 | 42 | |
Population by Age | 0-9 Yrs | 39 (14%) | 318 (12%) | 886 (10%) |
10-19 Yrs | 29 (10%) | 288 (11%) | 1093 (13%) | |
20-29 Yrs | 23 (8%) | 211 (8%) | 783 (9%) | |
30-39 Yrs | 44 (15%) | 357 (14%) | 968 (11%) | |
40-49 Yrs | 18 (6%) | 245 (9%) | 960 (11%) | |
50-59 Yrs | 42 (15%) | 388 (15%) | 1247 (15%) | |
60-69 Yrs | 42 (15%) | 345 (13%) | 1014 (12%) | |
70+ Yrs | 42 (15%) | 351 (14%) | 1120 (13%) | |
Median HH Income | $58,368 | $62,191 | $61,214 | |
Total Household Income | < 24K | 24 (20%) | 183 (17%) | 615 (17%) |
25-49K | 26 (21%) | 228 (21%) | 769 (22%) | |
50-74K | 27 (22%) | 234 (21%) | 742 (21%) | |
75-99K | 22 (18%) | 182 (17%) | 496 (14%) | |
100-199K | 19 (15%) | 210 (19%) | 700 (20%) | |
200K+ | 2 (1%) | 27 (2%) | 100 (2%) | |
Highest Education Level | No Diploma | 6 | 66 | 314 |
Diploma or GED | 79 | 693 | 2111 | |
Some College | 41 | 369 | 1253 | |
Assoc. Degree | 23 | 217 | 689 | |
Bachelors Degree | 33 | 293 | 832 | |
Higher Degree | 21 | 179 | 476 | |
Total Housing Units | 169 | 1,454 | 4,290 | |
--Owner-Occupied | 91 | 826 | 2,569 | |
--Renter-Occupied | 29 | 239 | 853 | |
Owner-Occupied Values | < 100K | 10 | 85 | 351 |
100-199K | 39 | 364 | 1194 | |
200-299K | 22 | 213 | 648 | |
300-399K | 15 | 113 | 248 | |
400-499K | 2 | 20 | 57 | |
500K+ | 3 | 31 | 71 | |
Total Working Age Population | 217 | 1,981 | 6,486 | |
In Work Force | 126 | 1,208 | 4,067 | |
Not In Work Force | 92 | 773 | 2,419 | |
Workforce Employed | 120 | 1,164 | 3,902 | |
Workforce Unemployed | 6 | 44 | 165 | |
Civlian Workforce | 126 | 1,208 | 4,067 | |
Military Workforce | 0 | 0 | 0 | |
Total Households | 120 | 1,065 | 3,422 | |
Family Households | 79 | 706 | 2,212 | |
Non-Family Households | 41 | 359 | 1,210 | |
Married Couple | 57 | 536 | 1,741 | |
Other Family | 22 | 169 | 470 | |
Married w/Child | 19 | 186 | 599 | |
Single Male w/Child | 10 | 67 | 125 | |
Single Female w/Child | 4 | 38 | 169 |
Population Change Last Two Decades - Plus Projection
2000 | % | 2010 | % | 2020 | % | 2030 | |
---|---|---|---|---|---|---|---|
Minnesota | 4,919,479 | +8 | 5,303,925 | +7 | 5,687,161 | +5 | 5,974,304 |
Chisago County | 41,101 | +31 | 53,887 | +5 | 56,696 | +4 | 58,713 |
Wisconsin | 5,363,675 | +6 | 5,686,986 | +6 | 6,005,080 | +6 | 6,375,910 |
Polk County | 41,319 | +7 | 44,205 | +8 | 47,680 | +12 | 53,240 |
Total Working Age Population:
Total Households:
Total Working Age Population:
Total Households:
Total Working Age Population:
Total Households: